CAT4 Scores Explained: What Is a Good CAT4 Score?
The average CAT4 score, often called a CAT score, is a Standard Age Score (SAS) of 100. Scores of 112 and above are above average (top 23%), 127 and above puts a child in the top 4%, and 88 and below is below average. Below, we walk through a full sample CAT4 report so you can read every score on your child's results.
The Cognitive Abilities Test (CAT4) measures students’ reasoning abilities. Understanding these scores helps parents and educators identify academic strengths, pinpoint areas for support, and guide learning pathways.
I’m Liron Katz, an assessment development specialist, and I designed this guide to help you clearly interpret these results and understand what they mean for your child's cognitive profile and potential.
CAT4 Test Results Explained
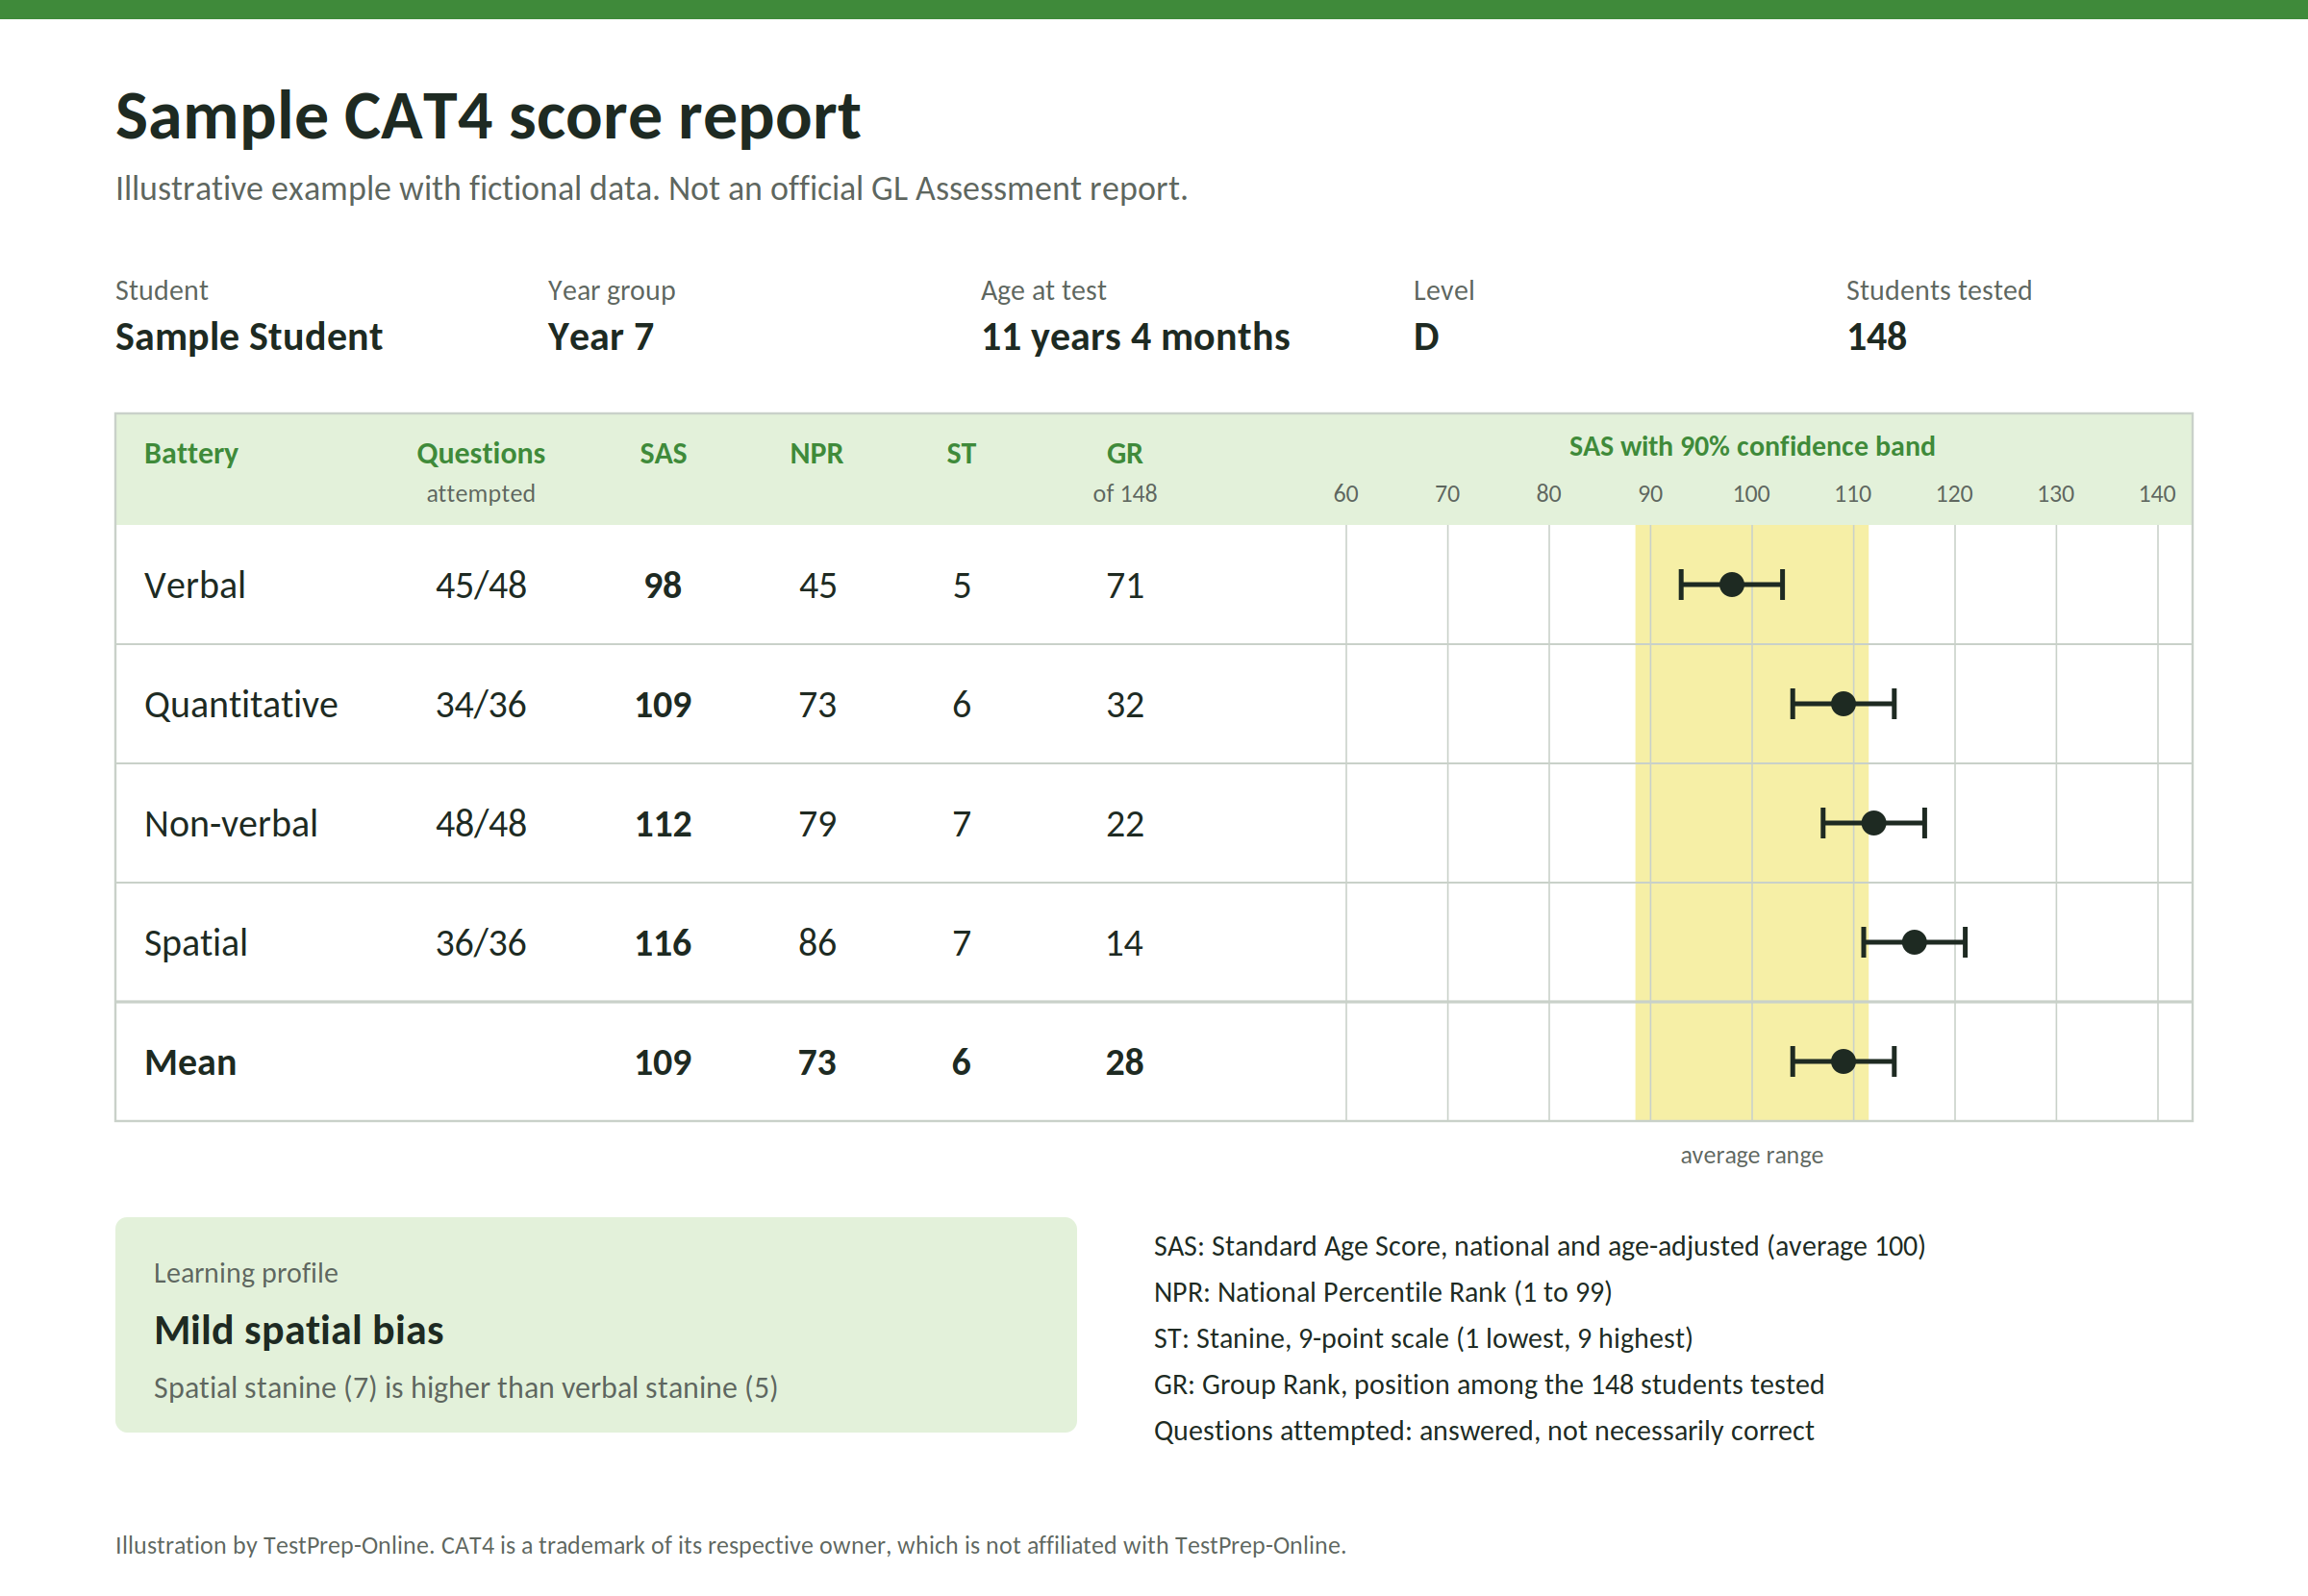
Understanding your child's CAT4 results starts with knowing what each part of the report shows. The sample report below uses fictional data and follows the layout of the individual report that teachers receive. Each part is explained in the order it appears.
Student Details
The top of the report records the student's year group, test level and exact age on the day of the test. Age matters because every score is calculated by comparing your child with students of the same age in years and months, not with everyone in the year group.
"Students tested" shows how many students sat the test in the same group. This number is needed to understand the group rank.
The Score Table
Each row shows one of the four CAT4 batteries, followed by the mean of all four. The columns are:
- Questions attempted: how many questions your child answered out of the total in that battery. An attempted question is not necessarily a correct one. The number of correct answers is the raw score, which is used to calculate all the other scores.
- SAS (Standard Age Score): the most important score used by schools. It adjusts the raw score for age and compares it with a national sample. It has a mean of 100 and a standard deviation of 15, and scores range from 69 to 141. Scores of 112 and above are above average, and scores of 88 and below are below average.
- NPR (National Percentile Rank): the percentage of same-age students nationally who scored the same or lower. An NPR of 86 means your child performed as well as or better than 86% of students of the same age.
- ST (Stanine): a simplified scale from 1 (lowest) to 9 (highest), based on the SAS. Stanines 4 to 6 are average, 1 to 3 below average and 7 to 9 above average.
- GR (Group Rank): your child's position among the students tested in the same group. A group rank of 14 means 14th out of 148. Unlike the other scores, this compares your child only with classmates, not with students nationally.
Together, these columns show both how your child compares nationally and where they sit within their own school group.
The Confidence Band Chart
The dot on each line marks the SAS, and the line around it shows the 90% confidence band. No single test sitting is perfectly precise, so the band shows the range in which your child's true score is very likely to fall. In this example, the mean SAS is 109, but the student's true ability is most likely somewhere between about 104 and 114.
The yellow area marks the average range. A dot to the right of the yellow area indicates above-average performance in that battery, and a dot to the left indicates below-average performance. When the bands of two batteries overlap heavily, the difference between those scores may not be meaningful.
The Learning Profile
The profile compares the verbal and spatial stanines to show whether your child may learn more easily through words or through visual and spatial methods. Profiles are described as a mild, moderate or extreme bias towards verbal or spatial learning, or as an even profile when the two scores are similar.
Here, the spatial stanine (7) is higher than the verbal stanine (5), so the profile shows a mild spatial bias. This suggests the student may find visual explanations, diagrams and hands-on tasks easier than purely verbal instruction. A profile describes a tendency rather than a fixed limit, and teachers use it alongside classroom observation.
What This Example Tells Us
Read together, the scores describe a student who is:
- average in verbal reasoning (SAS 98, stanine 5)
- at the upper end of average in quantitative reasoning (SAS 109, stanine 6)
- above average in non-verbal reasoning (SAS 113, stanine 7)
- strongest in spatial ability (SAS 116, stanine 7, ranked 14th of 148 in their group)
With a mean SAS of 109, the student is above the national average of 100 and sits towards the top of the average range. The gap between their verbal and spatial stanines is what produces the mild spatial bias in their learning profile.
The student left three verbal questions unanswered. That may point to timing rather than ability, and it is worth discussing with the school.
Will My Child's Report Look Like This?
Not necessarily. The report sent to parents is usually simpler. It shows each battery as below average, average or above average, with a written explanation of the profile and suggestions for support at home. Group rank normally appears only in teacher reports, which may also include indicators of likely future attainment at KS2, GCSE and A level. If you would like to see the detailed scores, you can ask your child's school.
What Is a Good CAT4 Score?
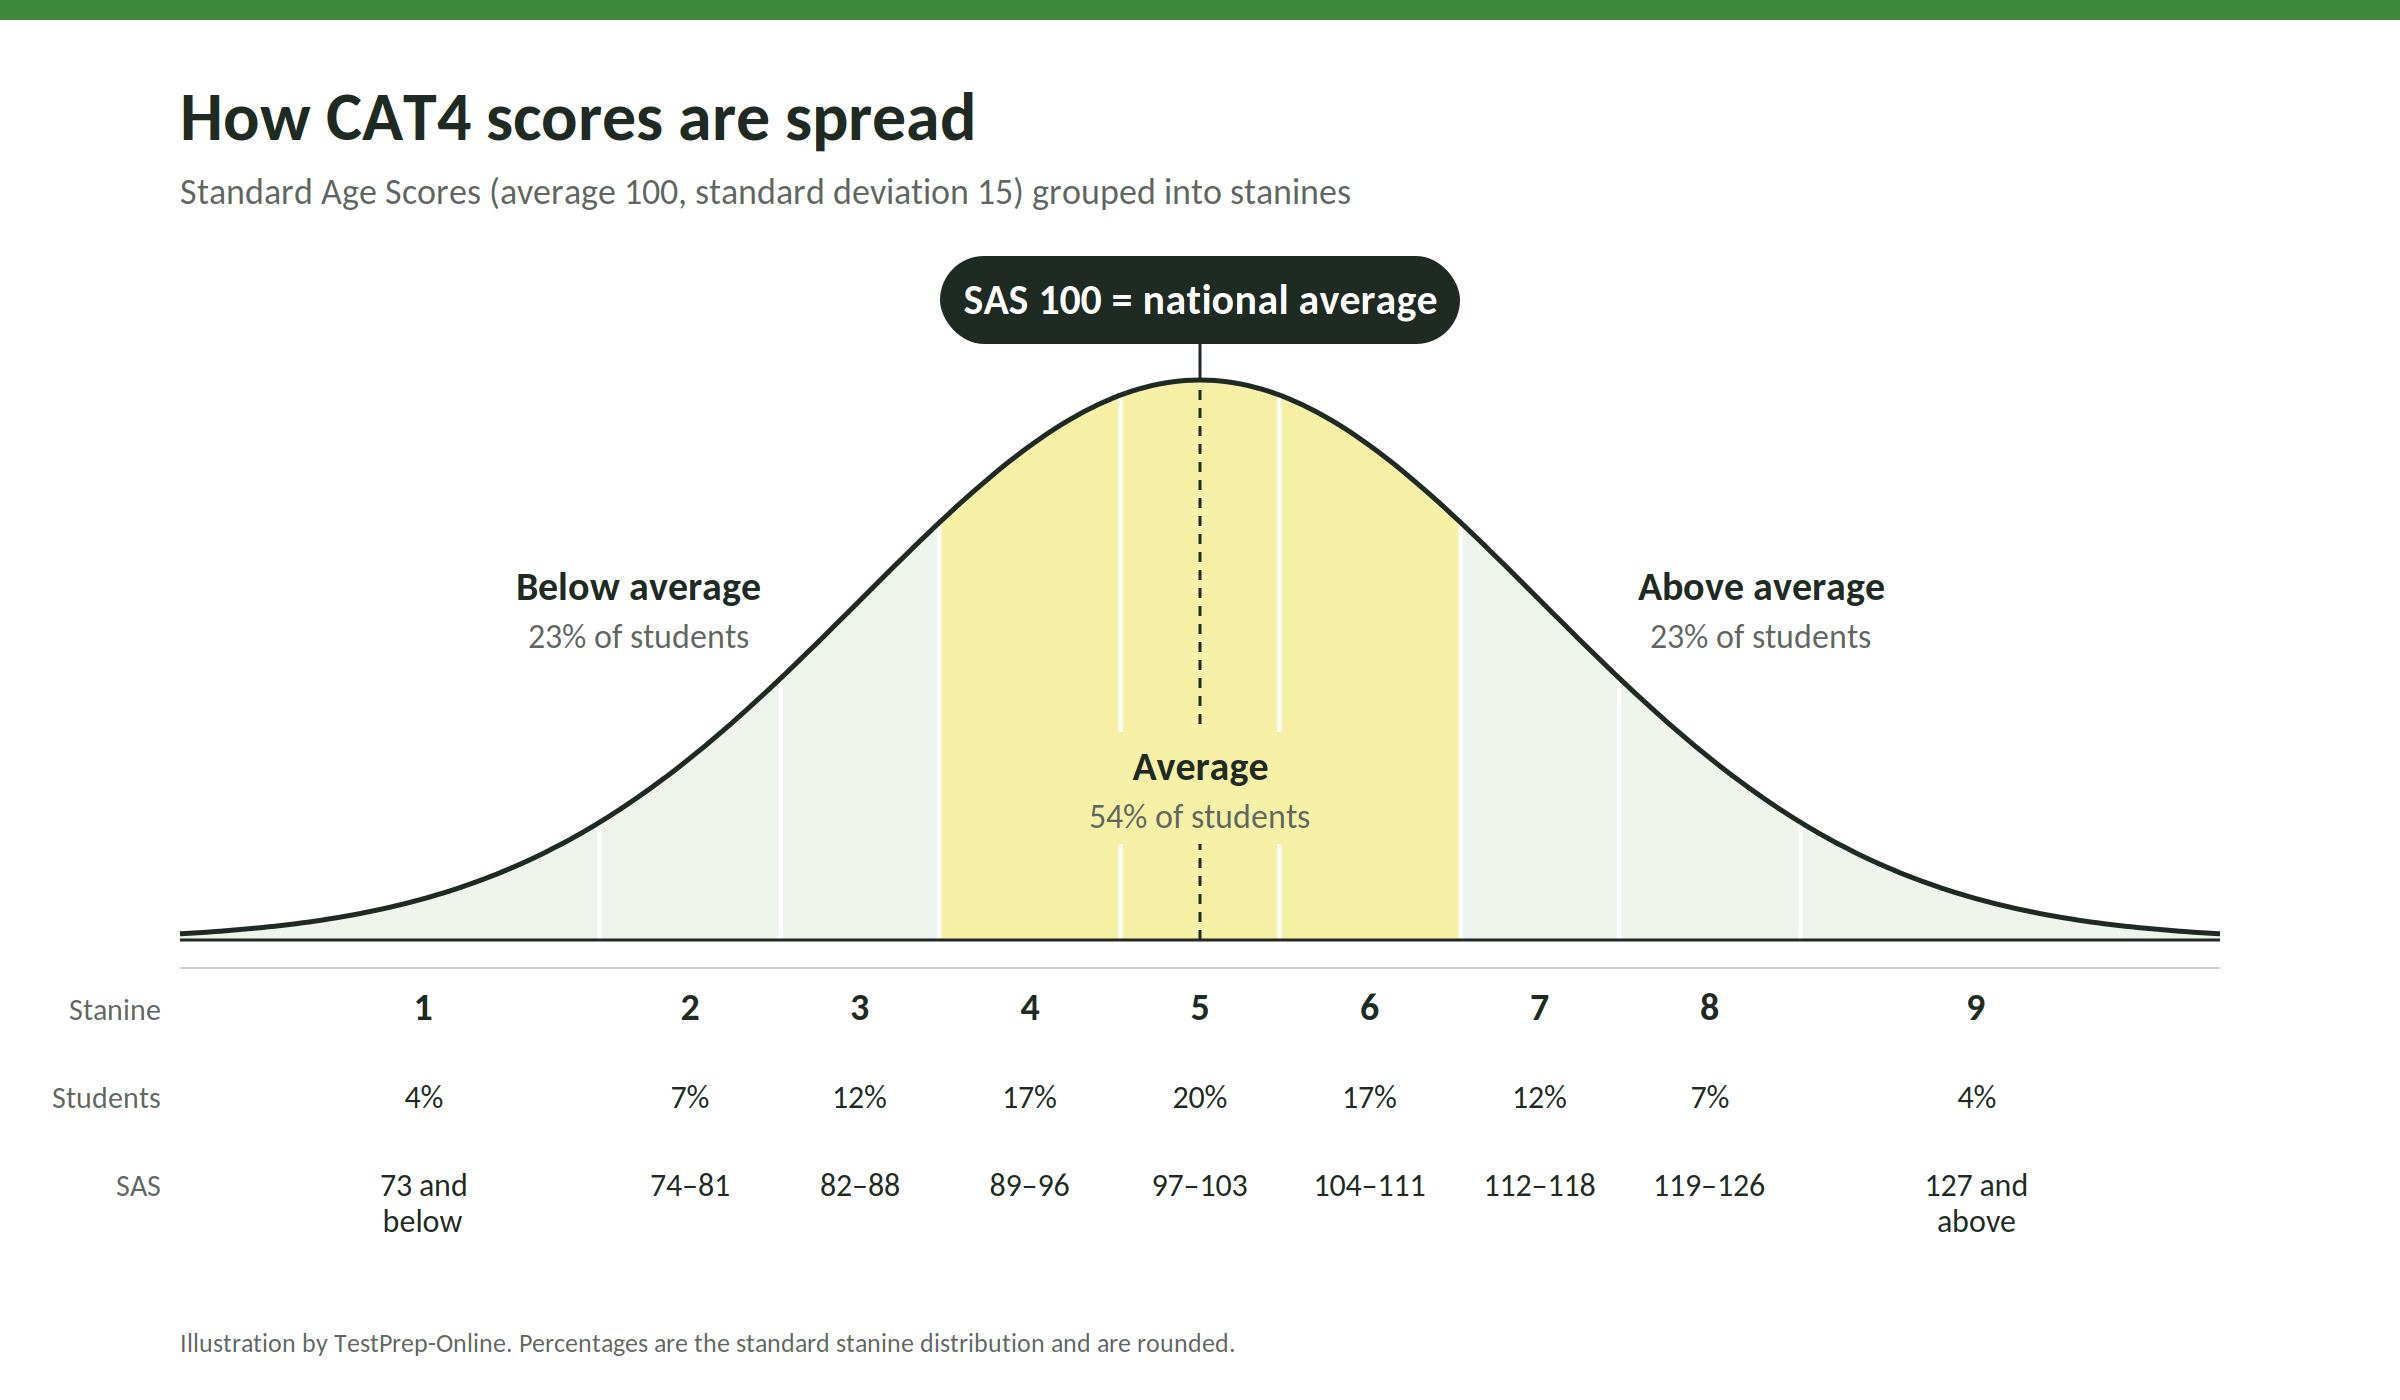
What counts as a good CAT4 score depends on how the result will be used, but every score is measured on the same scale. The chart below shows how Standard Age Scores (SAS) are spread across all children of the same age.
What is the average CAT4 score?
The average CAT4 score is an SAS of 100, which represents typical performance for a child of that exact age. Because every score is adjusted for age, 100 means the same thing in every year group. Just over half of all children (54%) score between 89 and 111, the average range shown in yellow.
What counts as a high or low CAT4 score?
Scores become less common the further they are from 100. The stanine bands give a simple guide:
- 127 and above (stanine 9): very high, achieved by the top 4% of children.
- 112 and above (stanines 7 to 9): above average, achieved by about 23% of children.
- 89 to 111 (stanines 4 to 6): average.
- 88 and below (stanines 1 to 3): below average, about 23% of children.
A below-average score does not mean a child lacks intelligence. It can help schools and parents identify where extra support may be useful.
What CAT4 Score Is Considered Gifted and Talented?
There is no single national threshold for gifted and talented programmes, and schools set their own criteria. The following ranges are often used as a guide:
- 130 and above in one or more batteries: typically identified as gifted, placing a child in the top 2% nationally.
- 120 to 129: a highly able student who is likely to benefit from extra academic challenge, roughly the top 9% to top 3%.
- A holistic view: schools combine high scores with daily classroom performance so that all talented students can access advanced work, regardless of background.
Because a high score in a single battery can be enough for a child to be identified, it is worth looking at each battery, not just the mean SAS.
Help Your Child Prepare for the CAT4 Exam
Is your child getting ready for the CAT4? Our CAT4 PrepPacks include realistic practice tests, detailed explanations and study guides to help your child:
Build confidence across all four batteries
Become familiar with every CAT4 question type
Develop the reasoning skills the test measures
Choose the PrepPack that matches your child's CAT4 level.
What Is a Good CAT4 Score in Year 5, 6 or 7?
A good CAT4 score is the same in every year group. An SAS of 100 is average whether your child is in Year 5, 6 or 7, and the same bands apply at every age: 112 and above is above average, 89 to 111 is average, and 88 and below is below average. A Year 5 child with an SAS of 110 has performed just as well, compared with children of the same age, as a Year 7 child with the same score.
Why is a good score the same in every year group?
The Standard Age Score (SAS) is the most important score in a CAT4 report because it allows children of different ages to be compared fairly.
A child's raw score is adjusted according to their exact age in years and months on the day of the test. This means a younger child is not compared directly with older classmates who may have had more time to develop their reasoning skills.
For example, if two children are in the same class but one was born in September and the other in August, CAT4 takes this age difference into account when calculating their SAS. Each child is compared with other children of the same age rather than with everyone in their year group.
This age adjustment helps ensure that CAT4 results give an accurate picture of a child's reasoning ability, regardless of when they were born.
Which CAT4 level does each year group take?
Each year group sits a level with questions suited to its age:
- Year 5: Level B (CAT4 Level B sample questions)
- Year 6: Level C (CAT4 Level C sample questions)
- Year 7: Level D (CAT4 Level D sample questions)
The questions become harder at each level, but the scores are standardised in the same way. A score of 100 on Level B therefore means the same as a score of 100 on Level D.
How do schools use CAT4 scores in Year 5, 6 and 7?
Although the scoring is the same, the purpose of the test often differs by stage:
- Year 5: schools often use CAT4 to identify strengths and areas for support before the move to secondary school.
- Year 6: independent and selective schools may use CAT4 as part of their entrance assessment for Year 7 entry. Each school sets its own threshold.
- Year 7: many secondary schools test new pupils early in the autumn term, using the results to place them in sets and to set targets, including indicators of likely GCSE performance.
Because schools use results differently, it is worth asking your child's school why the test is being taken and how the scores will be used.

What Is the Difference Between SAS and Group Rank?
Your child's Standard Age Score (SAS) compares their performance with a nationally representative sample of children of exactly the same age. A score of 100 is the national average, and an SAS means the same thing in every school.
Group Rank (GR) compares your child only with the other students who sat CAT4 in the same group, usually their year group at the same school. A GR of 14 out of 148 means your child placed 14th in that group. It says nothing about how the group performs nationally.
This is why the same SAS can produce very different group ranks. A child with an SAS of 115 might rank near the top of one school's cohort and around the middle of a highly selective one.
Which score do schools actually look at?
Schools use CAT4 scores for several major educational decisions, and each relies on a different score:
- School admissions: entry thresholds are usually expressed as an SAS, either the mean SAS or a specific battery. Applicants are then compared with each other.
- Class placement: group rank shows where a child sits among classmates, which helps schools form ability groups for different subjects.
- Setting goals: teachers use SAS-based indicators to set realistic target grades for future national exams such as GCSEs.
- Tracking progress: because SAS is benchmarked nationally, schools use it to monitor a child's development over time.
Policies vary between schools, so it is always worth asking which score your child's school uses and why.

What CAT4 score do private and international schools look for?
There is no national pass mark for CAT4. Each school sets its own requirements, and some focus on the mean SAS while others look closely at particular batteries, such as verbal or quantitative reasoning. To understand what a school's threshold means, it helps to know how each score compares nationally:
| SAS | NPR | Stanine | What it means |
| 141 | 99 | 9 | Highest possible score |
| 135 | 99 | 9 | Very high, top 1% |
| 130 | 98 | 9 | Very high, top 2% |
| 127 | 96 | 9 | Very high, top 4% |
| 125 | 95 | 8 | Above average, top 5% |
| 120 | 91 | 8 | Above average, top 9% |
| 118 | 88 | 7 | Above average, top 12% |
| 115 | 84 | 7 | Above average, top 16% |
| 112 | 79 | 7 | Above average, top 21% |
| 110 | 75 | 6 | Average (upper end), top 25% |
| 105 | 63 | 6 | Average |
| 100 | 50 | 5 | National average |
| 95 | 37 | 4 | Average |
| 90 | 25 | 4 | Average (lower end) |
| 88 | 21 | 3 | Below average |
| 85 | 16 | 3 | Below average |
Percentiles are based on the standard SAS scale (mean 100, standard deviation 15) and are rounded. The NPR on your child's report may differ by a point.
If a school looks for an SAS of 115, for example, your child would need to score higher than roughly 84% of children of the same age.
International schools, particularly those following a British curriculum, often use CAT4 as part of their admissions process. Because it measures reasoning rather than knowledge of a particular curriculum, it allows schools to compare applicants from different education systems. The non-verbal and spatial batteries also rely less on English, which can help schools assess children who speak English as an additional language. Children usually sit the level that matches their age or year group.
Private and international schools usually consider CAT4 results alongside previous school reports and interviews, so it is always worth asking the school directly how it uses the scores.
Getting ready for the CAT4?
Help your child practise with realistic CAT4 tests and detailed explanations, available for every level.

What Does a Spatial or Verbal Bias Mean?
As well as individual scores, every CAT4 report includes a learning profile. It shows whether your child may find it easier to learn through words or through visual and spatial thinking, and it helps teachers understand how best to support them in class.
What does each CAT4 battery measure?
CAT4 is made up of four batteries, each measuring a different type of reasoning:
- Verbal reasoning: thinking with words, such as spotting how words are related or grouping them by meaning.
- Quantitative reasoning: thinking with numbers, such as finding the rule behind a number series or a numerical relationship.
- Non-verbal reasoning: thinking with shapes and patterns, such as working out which figure completes a sequence or matrix.
- Spatial ability: thinking with shape and space, such as picturing how a shape would look when rotated, folded or combined with another.
Each battery receives its own SAS, NPR and stanine, so you can see where your child's strengths lie.
How is the learning profile worked out?
The profile compares your child's verbal reasoning and spatial ability results. These two batteries sit at opposite ends of a continuum, with quantitative and non-verbal reasoning combining the two in differing degrees. The profile uses the stanine scores for the two batteries and also takes into account the overall level of ability shown.
What are the CAT4 learning profiles?
Every student's profile falls into one of seven categories:
- Extreme, moderate or mild verbal bias: verbal reasoning is stronger than spatial ability.
- Even profile: verbal and spatial results are similar, with no discernible bias.
- Mild, moderate or extreme spatial bias: spatial ability is stronger than verbal reasoning.
"Mild", "moderate" and "extreme" describe how large the gap is between the two scores.
What does mild spatial bias mean?
A mild spatial bias means your child's spatial ability score is somewhat higher than their verbal reasoning score. They may find it easier to learn from diagrams, models, demonstrations and hands-on tasks than from purely written or spoken explanations.
A mild verbal bias is the reverse. Your child may learn more easily through reading, discussion and written explanation, and may find tasks that rely on visualising shapes or space more challenging.
A mild bias is the smallest category of difference, and many children with a mild bias learn well through both approaches.
What If My Child's CAT4 Score Is Low?
A low CAT4 score does not mean a child lacks intelligence. It acts as an early warning system to help schools and parents step in with the right support.
What can cause a low CAT4 score?
A score can be lower than expected for reasons that have little to do with ability. Common factors include:
- Test anxiety or panic caused by strict time limits
- Language barriers for students who speak English as an Additional Language (EAL)
- Undiagnosed learning difficulties or Special Educational Needs (SEND)
If one of these may have affected your child's result, it is worth raising it with the school.
What do schools do after a low score?
Schools use a low score as a starting point for support rather than a final judgement. Typical steps include:
- Providing small-group maths or reading interventions
- Offering one-to-one help for students with low verbal scores
- Screening for special educational needs or testing reading ages
- Re-testing the student after six months to get a more accurate reflection of their ability
Asking the school which of these steps it plans to take can help you support the same goals at home.
How Can My Child Prepare for CAT4?
CAT4 is significantly different from the regular school curriculum, so familiarising your child with the question types before the test is important. To help you prepare, TestPrep-Online offers CAT4 PrepPacks for Levels X-Y (years 2-3), Levels A-B (years 4-5), Levels C-D (years 6-7), Levels E-F (years 8-10) and Level G (11+), each containing sample questions, practice tests and detailed explanations. You can also start with our free CAT4 sample questions.
Frequently Asked Questions About CAT4 Scores
Not always. Schools decide what to share, and the report for parents is optional. When it is provided, it is simpler than the teacher's report. It shows each battery as below average, average or above average, with an explanation of your child's learning profile and suggestions for support at home. You can ask the school if you would like to see the detailed scores.
Online CAT4 tests are scored automatically, so schools can access the results immediately. Paper tests are sent to GL Assessment for scoring, and the reports are returned to the school within 15 working days. Schools then decide when, and how much, to share with parents.
No. CAT4 has no pass or fail mark. An SAS of 100 is the national average for your child's age, and each school sets its own threshold when it uses CAT4 for admissions or gifted programmes. Some schools look at the mean SAS, while others focus on particular batteries, so it is worth asking how your child's school uses the scores.
The highest possible CAT4 SAS is 141, and the lowest is 69. Scores far from the average are rare: only about 4% of children score 127 or above, which places them in stanine 9. Because every score is adjusted for age, the same scale applies to every year group.
No. CAT4 is a reasoning test published by GL Assessment that measures verbal, quantitative, non-verbal and spatial reasoning. The 11+ is a selective entrance exam for grammar and some independent schools, and its content varies by region and school. Some independent schools do use CAT4 as part of their entrance assessment, so check which test your child's target school uses.
Yes. An SAS of 112 is above average (stanine 7) and places a child in roughly the top 21% of children the same age. For selective purposes, though, it may not be enough on its own. Many independent schools set higher entry thresholds, often around 115 to 120 or above, and gifted and talented programmes typically look for scores of 120 to 130 or more. If your child is applying to a selective school, check that school's requirements. It's also worth looking at each battery, since a strong score in one area can matter as much as the mean SAS.
CAT4 measures reasoning ability, which tends to be fairly stable, but scores can vary between sittings within the confidence band shown on the report. Familiarity with the question types can reduce anxiety and help a child show their true ability on the day.
Ask Liron

A language and linguistics expert with an MA in Language Teaching and over a decade of experience developing assessment-aligned practice across multiple subjects that mirrors the rigor of real edtech tests. Liron creates prep packs with clear, structured exercises that enhance learning, adapt to digital tools, and empower every student to perform their best on a wide range of assessments


