A Parent’s Guide to the NWEA MAP Math Test: What to Expect and How to Prepare

The NWEA MAP Math test helps schools measure how well students understand and apply mathematical concepts at every grade level. This guide explains what the test covers, from number operations and algebraic thinking to geometry, measurement, and data analysis - so you can clearly see what skills are being evaluated. You’ll also learn how the adaptive format works and what types of questions students can expect. If your child needs additional practice, consider using our focused MAP Math preparation resources to strengthen skills, build confidence, and support continued growth.

Hi, I'm Ariav, a certified teacher with a Master’s in Education and a MAP Growth specialist with over a decade of experience developing MAP-aligned questions that match the real test’s rigor.

You can contact me with any inquiries at:

What Is the NWEA MAP Math Test?

The NWEA MAP Math Test is part of the MAP Growth assessment based on Common Core Standards. It measures a student’s mathematical understanding and tracks academic growth over time.

Unlike traditional grade-level exams, the MAP Math test is:

Computer-adaptive

Untimed

Growth-focused

The test is typically administered to students from Kindergarten through 12th grade, with content increasing in complexity at higher levels. For younger students in grades K–2, questions are read aloud to accommodate those who cannot yet read independently. The volume icon indicates audio support for these questions.

The NWEA MAP Math test typically has about 43–53 questions for most students in grades 2–12, and about 40–43 questions for early elementary (K–1), depending on the version of the test. The questions can be divided into 5 core areas:

Because the MAP Growth assessment is computer-adaptive, the exact number of questions can vary slightly by grade level and testing window. Most students finish within 45–60 minutes, but the test is untimed. 

Question Format on the MAP Math Test

The MAP Math test includes five main question types (depending on the grade level):

  • Multiple-Choice: Students select one correct answer from several answer options.
  • Multiple-Select: Students choose more than one correct answer when instructed.
  • Fill-in-the-Blank: Students type a numerical answer into a response box instead of selecting from choices.
  • Drag-and-Drop: Students move numbers, expressions, or other elements into the correct position to solve a problem.
  • Matching or Interactive Questions: Students match related items (such as equations and graphs) or interact with diagrams and number lines.

These formats allow the test to measure both basic computation and greater problem-solving skills while keeping the assessment adaptive and interactive.


Number & Operations

This section focuses on understanding numbers and how they work. Students solve problems involving addition, subtraction, multiplication, and division, as well as fractions, decimals, percentages, and place value. In higher grades, this area also includes working with integers and rational numbers.

NWEA MAP Number & Operations - 8th Grade

A store is having a sale where all items are 20% off. Sarah wants to buy a shirt that costs $40 and a pair of jeans that costs $30.

If the discount is applied to the total cost of both items, how much will Sarah pay in total?

Wrong

Wrong

Wrong

Correct!

Wrong

View Explanation

The correct answer is (D).

There are two ways to solve this question. You can find the discount of each item separately and then add the price after the discount, or you can add the prices of the items together and then calculate the discount from the total price.

Examine the second option and add the prices of both items and afterward, calculate the discount. To find the value of a certain percent of a number, multiply this percent (20% in this case) by that number, then divide the result you get by 100.

In this case, the two items cost 40 and 30 dollars, meaning that the total price is 70 dollars: (70×20) ÷ 100 = (70 × 10 × 2) ÷ 100 = (700 × 2) ÷ 100 = 1400 ÷ 100 = 14 Now that you know the value of the discount percent ($14) of the total price (70),reduceitfromtheoriginalpricetagandgetthecurrentcostduringthesale:70−14=56(). →Therefore, (D) is the correct answer.

Notice that answer (A) is 14, which is the value of the discount, not the total cost of the items after the discount, which is what the question is asking. Alternatively, you can reduce the percentage of discount (20%) from 100% and find the value of the discounted percent of the price: 100% - 20% = 80% and then 80 × 70 ÷ 100 = 56.

As mentioned, you can separate the two items (shirt and jeans) and calculate each percent separately and then sum them after the discount. This will be one extra step since there will be two percent calculations to perform instead of only one, but on the other hand, each of them could be simpler.


Algebra

This area measures a student’s ability to recognize patterns and solve equations. Students work with expressions, variables, ratios, proportions, and functions. As grade levels increase, problems become more complex and may involve solving multi-step equations and inequalities.

NWEA MAP Algebra - 6th Grade

6 × 25p = 450
What is the value of p?

Wrong

Correct!

Wrong

Wrong

Wrong

View Explanation

Explanation

The correct answer is (B).

Complete Explanation
To solve for the variable p, we need to isolate it by working systematically through the equation.

Method 1: Step-by-step approach

  • First, simplify the left side by calculating 6 × 25 = 150
  • This gives us: 150p = 450
  • To isolate p, divide both sides by 150:

150p ÷ 150 = 450 ÷ 150
p = 3

Method 2: Multiple steps with smaller operations

If larger calculations are challenging, we can break this down:

  • Write the equation: 6 × 25p = 450
  • Divide both sides by 6:

25p = 450 ÷ 6
25p = 75

Divide both sides by 25:

p = 75 ÷ 25
p = 3

Method 3: Working with distributive property

  • Recognize that 6 × 25p means 6 × 25 × p
  • Calculate 6 × 25 = 150 (or break down: 6 × 20 = 120, 6 × 5 = 30, 120 + 30 = 150)
  • Rewrite as 150p = 450
  • Divide both sides by 150: p = 3

Therefore, p = 3.


Geometry

The geometry portion tests understanding of shapes, angles, and spatial relationships. Students may calculate area, perimeter, and volume or work with coordinate planes and transformations. Higher-grade questions often require reasoning about geometric relationships and properties.

NWEA MAP Geometry - 3rd Grade

The following question is a MAP Math geometry sample. This question tests both terminology and deduction skills and corresponds to an RIT score of 191-200, which is an average third-grade score.

Select all the triangles that are equilateral.

Correct!

Wrong

Wrong

Wrong

Wrong

View Explanation

Explanation

The correct answer is A

Answer: Triangles A and F are equilateral.

An equilateral triangle has a special property - all three sides must be equal in length AND all three angles must be 60°. Let's examine each triangle carefully:

Triangle A: This triangle shows two angles labeled as 60°. For any triangle, the sum of all angles must equal 180°. So we can find the third angle:

60° + 60° = 120°
180° - 120° = 60°
Since all three angles are 60°, this makes triangle A equilateral.

Why the other triangles are NOT equilateral:

Triangle B: This has a 90° angle, making it a right triangle. Equilateral triangles can never have right angles.
Triangle C: This has two sides of length 7, but the bottom side is 3. This makes it isosceles (two equal sides), not equilateral.
Triangle D: This has different measurements for all sides (6.5, 6, and 7), making it scalene.
Triangle E: This has three different sides (50, 40, and has a right angle), making it a right triangle.


Measurement & Data

This section assesses how well students can measure, interpret data, and solve real-world problems. Students work with units of measurement, conversions, graphs, charts, and tables. They may also solve word problems involving time, distance, weight, and other measurable quantities.

NWEA MAP Measurement & Data - 11th Grade

Use the line plot below to answer the question.

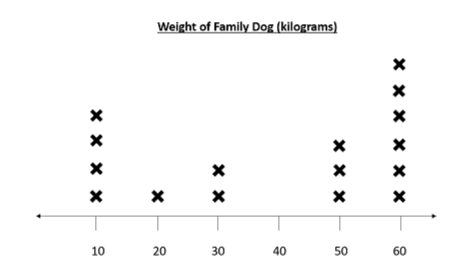
How many dogs were at least 50 kilograms in weight?

Wrong

Wrong

Correct!

Wrong

View Explanation

Explanation
The correct answer is (C).

Each cross on this line plot represents one dog. Thus, there were three dogs who weighed 50 kg. The question asks how many weighed at least 50 kg. At least 50 kg means 50 kg or more, so 50 kg or 60 kg. You must count the number of dogs who weighed 60 kg and add them on to the three dogs who weighed 50 kg.

There are six dogs who weighed 60 kg.

Therefore, the number of dogs who weighed at least 50 kg were: 3 + 6 = 9.

If you answered (A), you just counted the dogs who weighed exactly 50 kg.
If you answered (B), you counted the dogs who weighed less than 50 kg. At least means the same as or more.
If you answered (D), you counted the dogs who weighed at most 50 kg.


Statistics & Probability

This topic focuses on analyzing data and understanding chance. Students interpret graphs, calculate measures like mean and median, and solve probability problems. In upper grades, questions may involve more advanced data analysis and understanding patterns in distributions.

NWEA MAP Statistics & Probability - 10th Grade

Scenario: A local pizza shop tracked the number of pizzas delivered each hour during a Friday night shift. The data set below shows the number of deliveries made over 7 hours:
12, 15, 8, 22, 15, 10, 16

Calculate the Mean.

Correct!

Wrong

Wrong

Wrong

View Explanation

Explanation
The correct answer is (A)

Step 1:

Find the SumAdd all the data points together. This gives you the total "value" of the entire set.

12 + 15 + 8 + 22 + 15 + 10 + 16 = 98

Step 2:

Divide by the Count. Divide that total sum by the number of data points in the set. Since there are 7 hours of data, you divide by 7.

98/7 = 14
The Mean is 14.

How Our MAP Math Prep Packs Can Help 

Our comprehensive MAP Math Prep Packs are designed to help students build confidence and improve performance with: 

  • Grade-Specific Practice: Questions tailored to your child's grade level 
  • Adaptive Format: Simulates the real MAP test experience 
  • Detailed Explanations: Step-by-step solutions for every question 
  • Content Alignment: Materials matched to the latest MAP test specifications 
  • Progress Tracking: Monitor improvement areas 

Our prep packs are available for all grade levels and include practice tests, targeted quizzes, and strategy guides to help your child maximize their MAP math performance. 


FAQs

Most schools administer the MAP test 2-3 times per year (fall, winter, and spring). 


The test is untimed, but most students complete it in 40-60 minutes. 


No, the MAP test is not pass/fail. It measures academic progress relative to grade-level expectations. 


No, the MAP test is designed to measure growth over time rather than pass/fail performance. 


While cramming isn't effective, regular practice with grade-appropriate math concepts will help your child perform their best. Buy a MAP Test PrepPack and practice throughout the year.


You can find grade-level practice questions to preview our test prep packs. 

Kindergarten

1st Grade

2nd Grade

3rd Grade

4th Grade

5th Grade

6th Grade

7th Grade

8th Grade

9-12th Grades


Close