What is a Good CogAT Score & How is it Measured?
Receiving your child’s CogAT Form 8 score report can feel overwhelming due to the complex metrics and acronyms. As a CogAT specialist with an education background and a degree in Physics and Astronomy, I, Roni, will help you analyze these results calmly. Discover how scores are calculated, learn what each number represents, and understand how schools utilize this data to evaluate your child's unique learning profile.
What Is CogAT Form 8?
CogAT Form 8 is the current version of the Cognitive Abilities Test. Schools use it to assess how students think and reason, rather than what they have learned in the classroom.
The test assesses three core reasoning areas:
- Verbal Reasoning (V): Working with words, language, and verbal relationships
- Quantitative Reasoning (Q): Working with numbers, logic, and patterns
- Nonverbal Reasoning (N): Solving visual and spatial problems using pictures and shapes
Together, these three areas form a composite score, which schools often consider when making decisions about gifted identification, enrichment placement, and instructional planning.
What the CogAT Measures and What It Does Not
The CogAT is designed to examine patterns of reasoning that support learning, rather than knowledge acquired through instruction.
The CogAT helps identify:
- How a child reasons when learning new material
- Areas where learning comes more naturally
- Areas where additional guidance may support learning
- Areas where a different instructional approach may be effective
Important Clarification: CogAT Is Not an IQ Test
Although the CogAT measures reasoning abilities related to learning, it does not define intelligence or predict future success. Instead, it is one tool schools use to better understand a child’s learning patterns and reasoning strengths.
What Each CogAT Battery Reflects in the Score Report
CogAT scores are reported separately for three reasoning areas. Each battery reflects a different way a child approaches thinking and problem-solving, which helps explain score patterns and strengths on the report.
Verbal Reasoning Battery (V)
The Verbal Battery reflects how a child reasons using words and language. Verbal scores on the CogAT report are influenced by a child’s ability to:
- Understand vocabulary
- Recognize relationships between words
- Follow and process spoken language
- Use verbal reasoning and categorization
These skills support reading, writing, and communication across subjects.
Quantitative Battery (Q)
The Quantitative Battery reflects how a child reasons with numbers and numerical relationships, rather than how well they perform grade-level math.
- Recognizing patterns
- Comparing quantities
- Understanding number relationships
- Solving reasoning tasks that involve numbers
Because the focus is on reasoning, not computation, this score helps explain how a child thinks when working with numerical information.
Nonverbal Battery (N)
The Nonverbal Battery reflects how a child reasons using visual and spatial information, without relying on language.
- Recognizing visual patterns
- Solving puzzles
- Analyzing designs
- Thinking spatially
Because language is removed, this score often highlights strengths that may not be as visible in language-based classroom tasks.
Understanding the Main CogAT Score Types
CogAT reports provide multiple comparison types to explain a student’s performance from different perspectives. Together, these scores create a complete picture of your child’s reasoning abilities.
Depending on the objective, schools may review three types of norms:
- Age-Based Norms: Comparing a student to others of the same age nationwide.
- Grade-Based Norms: Comparing a student to others in the same grade nationwide.
- Local Norms: Comparing a student to others within their specific school district.
Below is a sample report, followed by a detailed explanation of each reported score.
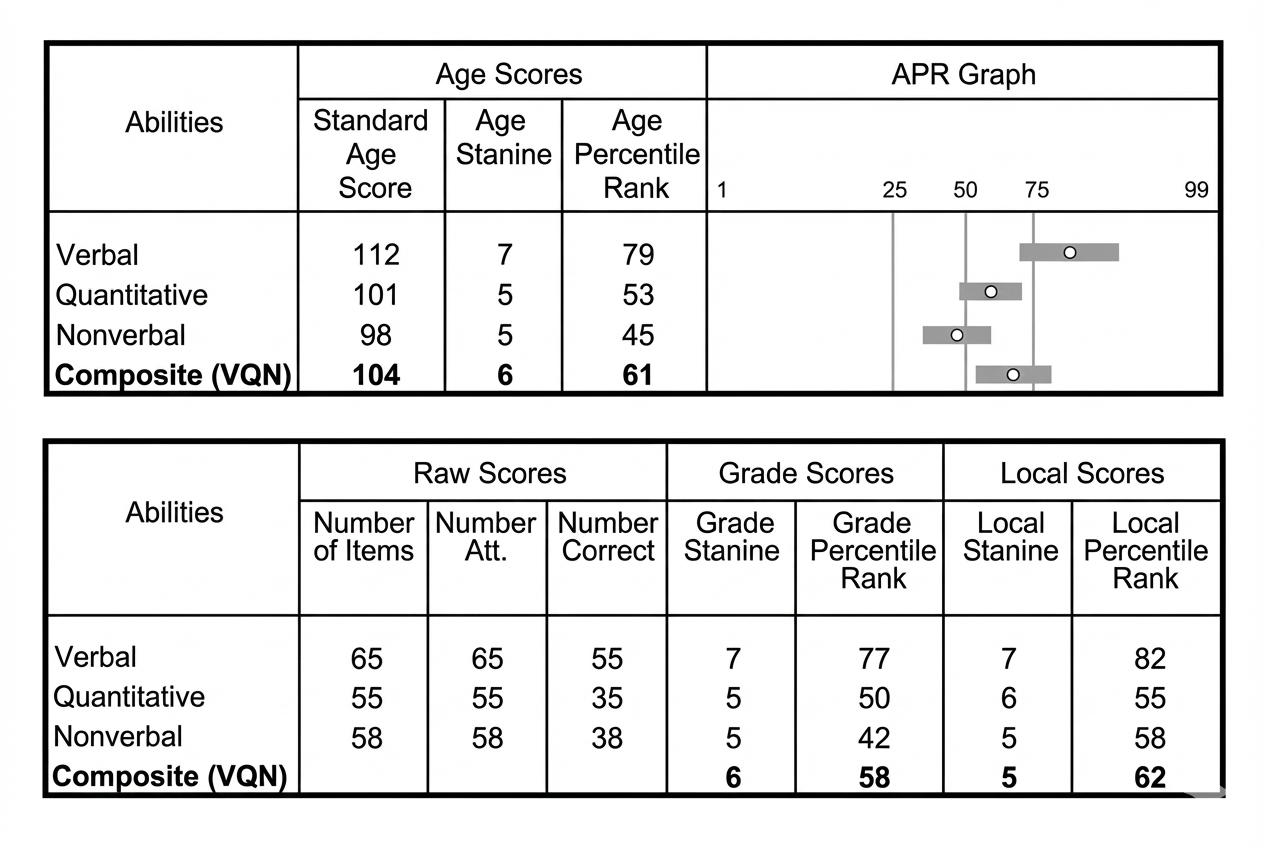
Age Scores
Age Scores compare your child to other students across the country who are the same age (in months) at the time of testing.
This is the most accurate way to understand reasoning ability because it accounts for age differences within a grade.
Standard Age Score (SAS)
The SAS shows your child’s overall level of reasoning ability compared to same-age peers nationwide.
The average score is 100. Scores higher or lower than 100 show how far above or below the national average your child’s reasoning skills fall.
Age Stanine (AS)
The Age Stanine places your child into one of nine broad groups, from 1 (lowest) to 9 (highest), based on performance compared to students the same age.
Stanines give a general performance range rather than an exact score.
Age Percentile Rank (APR)
The APR shows the percentage of same-age students nationwide who scored below your child.
For example, an APR of 60 means your child scored higher than 60% of students their age.
This score is converted from the Standard Age Score.
APR Graph
The graph visually displays where your child’s score falls compared to the national age-based group.
It helps parents quickly see whether performance is below average, average, or above average without focusing on numbers alone.
Raw Scores
Raw scores show how your child interacted with the test itself.
These scores are not comparisons and are mainly used to calculate other CogAT scores.
Number of Items
The total number of questions included in that test section.
Number Attempted
The number of questions your child tried to answer.
This can help show if any questions were skipped.
Number Correct
The number of questions your child answered correctly.
Grade Scores
Grade Scores compare your child to other students in the same grade level across the country who took the test at the same time of year.
Grade Percentile Rank (GPR)
The GPR shows how your child performed compared to students in the same grade nationwide.
It represents the percentage of students in that grade who scored lower than your child and is converted from the Standard Age Score.
Grade Stanine (GS)
The Grade Stanine places your child into one of nine performance groups compared to students in the same grade.
This provides a quick, broad comparison within grade level rather than an exact ranking.
Local Scores
Local Scores compare your child to students who participated in the same testing event, such as within the school, district, or system.
Local Percentile Rank (LPR)
The LPR shows the percentage of students in the local testing group who scored lower than your child.
Like other percentile ranks, it is based on the Standard Age Score.
Local Stanine (LS)
The Local Stanine places your child into one of nine groups compared to students in the same local test group.
This helps schools understand how students perform within their own learning environment.
What Appears on the CogAT Score Report
Many schools send home an Individual Profile Narrative Report, which presents scores numerically, visually, and in written narrative form. This report is specifically designed to help families understand how a student learns, not just how they scored.
Most parents notice the Score Profile, which combines a number and a letter, such as 7A, 8B, or 9C. A sample score profile looks like this:

Choose Your Grade Level CogAT Prep Pack
Supporting Strengths at Home
Verbal Strength (V+)
Children with verbal strengths often show strong comprehension and expressive language.
Helpful activities include:
- Reading together and discussing stories
- Asking open-ended questions
- Encouraging storytelling and descriptive play
- Playing word, rhyme, and category games
Quantitative Strength (Q+)
Children with quantitative strengths often enjoy logic and patterns.
Helpful activities include:
- Pattern blocks, building toys, and logic games
- Sorting and comparing objects
- Simple number puzzles
- Counting and measuring during daily routines
Nonverbal Strength (N+)
Children with nonverbal strengths often learn best visually.
Helpful activities include:
- Puzzles, tangrams, and drawing activities
- Building and construction projects
- Exploring maps and diagrams
- Shape and pattern matching games
What CogAT Scores Do and Do Not Mean
CogAT Scores Do:
- Measure reasoning potential
- Help schools plan instruction
- Identify students for enrichment
CogAT Scores Do Not:
- Measure intelligence
- Predict life success
- Define limits
The CogAT is one data point, not a verdict.
Score Warnings Parents Should Know
Too Many Omitted Questions
Children who work slowly but accurately may have scores that underestimate ability. Schools flag this internally.
Chance-Level Scores
Very low scores may reflect fatigue, guessing, or disengagement rather than true ability. These scores are reviewed before interpretation.
Ask Roni

An educational technology expert with a background in Physics and Astronomy and over nine years of experience designing AI-enhanced assessment materials that mirror real digital testing environments. Roni creates prep packs with clear, thoughtfully structured practice that strengthen understanding, build confidence with edtech tools, and empower every learner to succeed in an evolving digital landscape.
CogAT Scores FAQ
A good CogAT score depends on the purpose. An SAS of 100 is average. Many gifted programs look for scores around 120–130 or higher, but criteria vary by district.
Age scores compare your child to others of the same age, while grade scores compare them to classmates. Age scores are often preferred for fairness, especially for younger or older students within a grade.
Reasoning skills develop over time. Familiarity with question formats, confidence, and maturity can all influence future results.
Yes. Each battery is scored separately, but they are also combined into a Composite Score that reflects overall cognitive ability.
No. Scores can be influenced by development, attention, language exposure, and test-day factors. Classroom performance and growth matter just as much.
Many schools administer the CogAT more than once, often at different grade levels.


