MAP Scores by Grade Level: Understand Your Child's RIT Score
Turn RIT Results into a Winning Action Plan
MAP scores aren't just numbers; they are a roadmap of where your child is today and where they need to go. As an NWEA specialist with a Master’s in education, I, Ariav Schlesinger, help you decode the RIT scale and percentiles so you can support real growth.
Don't just read the score, improve it. Most parents use these scores to identify gaps. Our PrepPacks are specifically designed to target those gaps and raise RIT percentiles
What Are NWEA MAP Test Scores?
Unlike traditional tests, MAP scores provide a personalized snapshot of your child's abilities in math, reading, language usage, and science. The MAP Test measures actual learning and academic growth over time, not just grade-level comparisons.
Key characteristics of MAP scoring:
- Adaptive testing format: Questions adjust in real-time based on student responses, becoming harder after correct answers and easier after incorrect ones
- RIT scale measurement: Uses the Rasch Unit (RIT) scale ranging from approximately 100-350, providing consistent measurement from kindergarten through 12th grade
- Growth-focused approach: Tracks individual progress over time rather than comparing students against each other
- Subject-specific assessment: Evaluates performance separately in mathematics, reading, language usage, and science
RIT – The MAP Scoring System
“think of your child’s RIT score as a “you are here” dot on the path of academics”
What makes the MAP unique is the way it is scored, and that brings us to the scale of academic progress called RIT (Rasch Unit). The MAP Growth score report may have a lot of numbers you’re not used to seeing, but after reading this quick explanation, you’ll find that those numbers are actually quite easy to follow as they provide an in-depth picture of your child’s progress in school. Put simply, think of your child’s RIT score as a “you are here” dot on the path of academics. How does it work? Let’s dive into it:
What exactly is RIT?
“an RIT number can be said to measure the level of a specific skill or knowledge that a question is assessing, and by extension, the level of the student who answers it correctly.”
Most tests present you with a set number of questions at a particular level, designed to check how well you understand the relevant material. The questions are identical for everyone in that grade level, and the score reflects the percentage of questions answered correctly. For example, a student in high school may score a 75% by correctly answering 3 out of every 4 questions on material learned that year, while a 1st grade student will score a 90% succeeding in 9 out of 10 questions at a much lower level. This indicates how well the student understands the material recently taught, but it does not provide a broad picture of their learning.
RIT Scoring
“Therefore, an RIT number can be said to measure the level of a specific skill or knowledge that a question is assessing, and by extension, the level of the student who answers it correctly.”
The RIT system measures academics from kindergarten through 12th grade, assigning numbers to all of the material learned from around 100 to 350, in order to quantify advancement. Something learned in 1st grade will naturally be assigned a much lower RIT number than something learned in 9th grade. The NWEA takes Common Core standards that all conventional schools teach and assigns RIT levels to their benchmarks along the way. Therefore, an RIT number can be said to measure the level of a specific skill or knowledge that a question is assessing, and by extension, the level of the student who answers it correctly. Students who succeed on questions at a given level suggest they have reached that level in their academic progress.
RIT Scores and MAP Test Adapting
On a MAP test, the students will begin by facing questions around the average RIT level for their grade, then the test adapts to the answers submitted by presenting higher or lower in level questions, depending on whether the student answered correctly or incorrectly. By the end of the test, the system has enough responses to calculate what RIT number reflects the level of question the student has a 50% chance of answering correctly in a given subject. That RIT number will serve as the score, pinpointing that student’s progress in academics. Naturally, older students will score higher numbers than younger students, as they have been taught more, and will therefore be expected to be further along in their learning. The NWEA then compares all the RIT scores against those within the same grade (as well as other comparisons we will see soon) which provides an accurate reflection of a student’s progress compared to where he or she is expected to be.
Understanding Your Score Report
The report you receive highlights your raw RIT score and also helps you understand where that places you on your continuous educational journey, as well as how it compares to the average for your age. It does so by including your past scores and tracking your improvement or regression, calculating your rate of growth, and showing you visual representations of where your scores stand as compared to the average for both your district and the whole country.
Let’s break down how you can find all this information on your report:
The MAP Growth Chart: Visual Progress Tracking
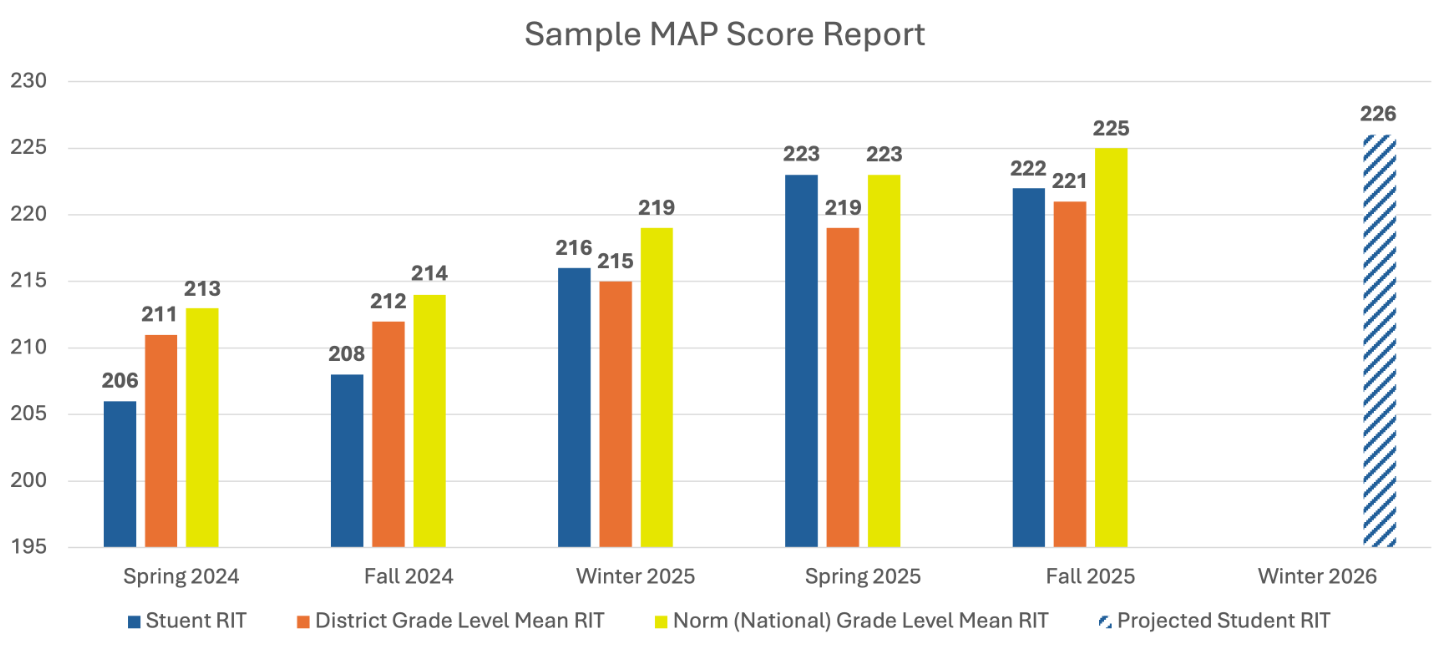
The graph shows your child's RIT score trajectory over multiple testing periods, typically including fall, winter, and spring assessments.
Key elements of the growth chart
Student RIT Score (Blue Bar): This line plots your child's actual performance across testing terms. Look for upward trends indicating consistent growth. Flat or declining sections may signal learning challenges that need attention.
District Grade Level Mean (Orange Bar): Shows the average score for all students in your child's grade within your school district. Comparing your child's line to this benchmark reveals whether they're performing above, at, or below the local average.
Norm Grade Level Mean (Yellow Bar): Represents the nationwide average for students in the same grade during the same testing term. This broader comparison shows how your child compares to peers across the country.
Projected Growth (Blue and White Striped Bar): Based on research studying millions of students, this line predicts where your child's score should be at future testing points. If your child's actual scores exceed this projection, they're growing faster than expected. Scores below the projection suggest they may need additional support.
What to look for in the chart
Growth patterns matter more than absolute scores. A student starting at the 40th percentile who shows consistent upward movement is making excellent progress. Conversely, a student starting at the 80th percentile with flat growth may need intervention despite their high position.
Significant drops between testing periods warrant investigation. Consider factors like test anxiety, major life changes, extended absences, or learning gaps that developed during that term.
Growth over time
All historical data for the student is available at the bottom of the page.

The Student Progress Report Table: Detailed Score Analysis
This table, typically positioned beside the growth chart, provides numerical data for each testing term.
Column explanations:
- Term: Lists each testing period chronologically (Fall 2024, Winter 2025, Spring 2026, etc.)
- Grade: This is the grade that the student is in.
- RIT (+/- Standard Error): Shows three numbers; the middle value is your child's actual RIT score, while the other two define the confidence range. For example, "203-207-211" means your child scored 207, with their true ability level likely between 203 and 211.
- Percentile Range: Similar to RIT scores, this shows your child's percentile ranking with a confidence band. A range of "58-63-68" means your child ranked at the 63rd percentile, with their true ranking likely between the 58th and 68th percentiles.
- RIT Growth: The numerical change in RIT score from the previous testing term. Positive numbers indicate improvement; negative numbers suggest decline. Typical growth ranges from 2-8 points per term, depending on grade level and subject.
- Growth Projection: The average RIT growth for students nationwide who started the term with a similar RIT score. Compare your child's actual growth to this benchmark to assess whether they're growing faster, slower, or at the expected rate.
- Projected RIT: Predicts your child's score for the next testing term based on their historical performance and national growth norms. This serves as a target for the upcoming assessment period.
Each skill area shows your child's RIT level for that specific skill, often categorized as Low, Below Average, Average, Above Average, or High. These descriptors help you identify exactly where your child excels and where they need extra practice.
The Lexile Range: Matching Books to Reading Level
For Reading and sometimes Language Usage, the report includes a Lexile range (e.g., "850L-1000L"). This measurement helps you select appropriately challenging books for your child.
How to use Lexile ranges:
Books labeled within your child's Lexile range should be at an appropriate difficulty level—challenging enough to promote growth but not so difficult they cause frustration. Most libraries and bookstores include Lexile levels in their databases, making it easy to find suitable reading material.
For independent reading, choose books at the lower end of your child's range. For guided reading with teacher or parent support, books at the higher end work well. Reading slightly above your child's Lexile level with assistance helps them develop more advanced skills.
Understanding Percentile Rankings: What They Really Mean
Percentile rankings tell you how your child's performance compares to other students nationwide who took the test during the same term. This comparison provides context for the RIT score.
How to interpret percentiles:
- 50th percentile (median): Your child performed better than half of test-takers and scored lower than the other half—this represents average performance
- 75th percentile: Your child scored higher than 75% of students nationally, indicating above-average achievement
- 90th percentile: Your child performed better than 90% of peers, showing strong academic skills
- 95th percentile: Your child is in the top 5% nationally, demonstrating exceptional ability in that subject
- 25th percentile: Your child scored higher than 25% of students, suggesting the need for additional support
Important distinction between RIT scores and percentiles:
Your child's RIT score measures absolute academic ability and should increase over time as they learn more. Percentile rankings, however, compare relative standing among peers and may remain stable even as RIT scores increase; this is normal and expected.
A student maintaining the 60th percentile while their RIT score grows from 180 to 210 throughout elementary school is making excellent progress. They're learning at the same rate as other students nationally while keeping pace with their peer group.
MAP Growth Norms Explained: What RIT Scores Mean for Each Grade
“you can view what RIT ranges are standard, below average, or advanced for every grade, every subject, and even at each stage of the school year”
In addition to the detailed report with your own personal scores, the NWEA has recently released their complete updated norms. These norms help you understand whether a RIT score is considered below average, typical, or advanced for a student’s grade and time of year. This can help you learn what ranges to target or simply provide you with more context as to where your child stands on the greater scale of academic growth. For example, if you are moving to America with English as a second language and taking the MAP Growth for your prospective school, you can view which grade level the Reading and Language Usage scores most closely align with, and that will help you find the right level material to study in order to improve most efficiently. If your child is a math-wiz and you want to know if he or she might be ready for classes in a higher grade level, check the chart and see how advanced the scores are in relation to each grade!
NWEA MAP Scores By Grade Level: 2026 Chart
We’ve summarized these charts for you here on this page, integrating the information together for your convenience:
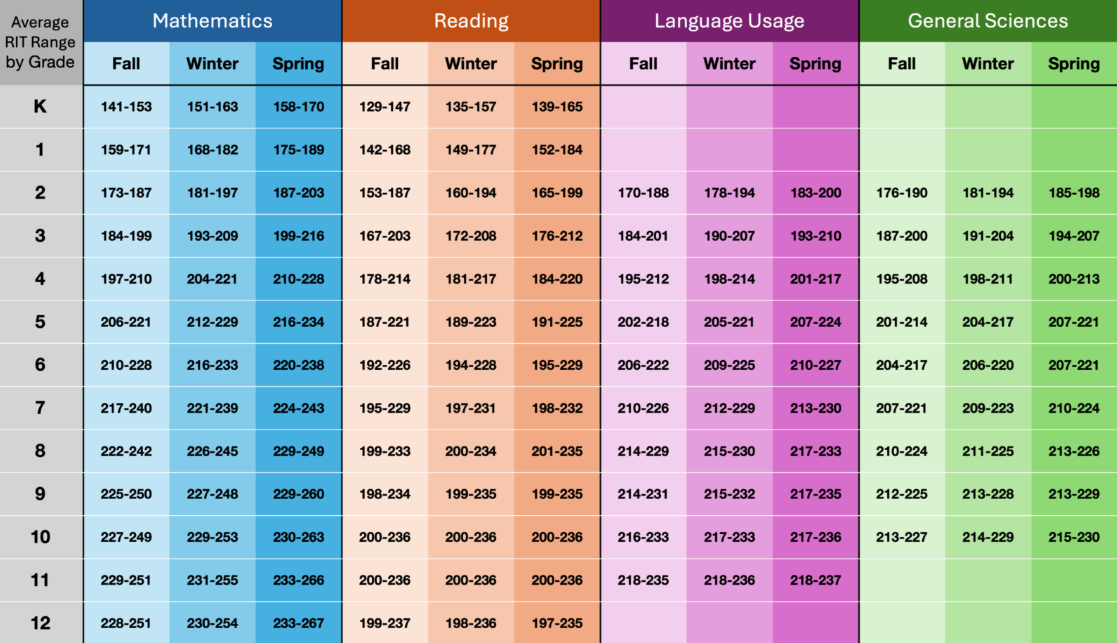
This MAP scores by grade level chart tells you the most common scores for each subject, in which grade, and at what point in the year. These ranges hover around the mean, each with its own standard deviation, such that scores above or below the numbers listed would begin to be considered above or below average.
Notice that in the earlier years, RIT score levels advance quite quickly and vary greatly between grades and terms. This is because the relative growth based on the new information learned at these ages is much higher, whereas high schoolers are refining their knowledge in less drastic ways. Additionally, high schoolers begin to learn different fields that are not necessarily learned by everyone, such as calculus or chemistry, and this growth will not show up on MAP results as the test tracks standards common to all students. The NWEA has specialized tests designed to assess some such high school subjects. All this to say, there is no reason to worry that your RIT score is not advancing at the rate it did in earlier years.
NWEA MAP RIT Scores for Gifted Programs
| Grade | Mathematics | Language | Reading | |||
| K* | 160 | 152 | -- | -- | 157 | 149 |
| 1* | 181 | 172 | -- | -- | 177 | 169 |
| 2 | 196 | 188 | 200 | 190 | 197 | 187 |
| 3 | 211 | 202 | 213 | 203 | 214 | 203 |
| 4 | 223 | 214 | 222 | 212 | 224 | 213 |
| 5 | 234 | 224 | 228 | 219 | 231 | 221 |
| 6 | 241 | 231 | 233 | 224 | 237 | 227 |
| 7 | 249 | 238 | 237 | 227 | 241 | 231 |
| 8 | 256 | 244 | 240 | 230 | 246 | 235 |
| 9 | 259 | 246 | 242 | 232 | 250 | 238 |
| 10 | 262 | 249 | 244 | 234 | 251 | 239 |
| 11 | 266 | 252 | 245 | 236 | 253 | 241 |
| 12 | 284 | 276 | 274 | 258 | 283 | 259 |
*Please note that there are no NWEA MAP Language Usage tests in kindergarten and 1st grade.
Pave Your Child's Way to Success
Give your child the best chance to score high - start practicing today!
Ask Ariav

A certified teacher with a Master’s in Education and a MAP Growth specialist with over a decade of experience developing MAP-aligned questions that match the real test’s rigor. Ariav creates materials with clear, detailed explanations that build understanding, boost reasoning skills, and help every child perform their best on the MAP Growth assessment.
Frequently Asked Questions About MAP Scores
A good MAP score depends on your child's grade level, previous scores, and growth trajectory. Generally, scoring at or above the 50th percentile indicates average performance, while scores at the 75th percentile or higher show above-average achievement. However, consistent growth matters more than absolute scores. A student at the 40th percentile showing steady improvement is making excellent progress.
Yes, though MAP tests measure learned academic skills rather than test-taking strategies. The best preparation involves strengthening actual math, reading, and language skills through regular practice. Familiarizing students with the computer-based adaptive format can also reduce anxiety and improve performance.
MAP scores are available immediately after testing, though schools typically review data before sharing results with families. Most schools send reports home within 1-2 weeks of testing or discuss scores during parent-teacher conferences.
No, MAP scores are not used for college admissions. They're designed for K-12 growth monitoring and instructional planning. However, strong academic growth demonstrated through MAP testing often correlates with college readiness indicators like SAT/ACT scores and AP performance.
Small decreases (within the standard error range) may reflect normal testing variability. Larger decreases warrant investigation. Consider factors like test anxiety, health issues on test day, gaps in instruction due to absences, or learning difficulties that need attention. Discuss significant score drops with your child's teacher.
MAP scores may inform retention discussions but should never be the sole determining factor. Schools consider multiple data points including classroom performance, work samples, teacher observations, attendance, and other assessments. MAP provides one piece of evidence but doesn't make retention decisions alone.
MAP Reading scores include a Lexile range that indicates the complexity of texts your child can comprehend. This helps match students with appropriate books. However, interest and motivation also affect reading ability, students often read above their Lexile level when engaged with a topic they care about.
Uneven performance across subjects is common and normal. Many students excel in math but struggle with reading, or vice versa. Use the score differences to identify where to focus extra support rather than viewing them as cause for alarm. Significant strengths can also be celebrated and further developed.


