Understanding OLSAT Scores: A Guide for Parents
Interpreting Otis–Lennon School Ability Test (OLSAT) scores is critical for navigating gifted and talented admissions. As a gifted-testing specialist, I, Ariav Schlesinger, have analyzed hundreds of reports to help parents demystify raw scores, School Ability Indexes (SAI), and percentiles. Explore this guide to understand how school districts utilize these metrics and learn exactly how your child's results impact program placement.
Understanding Your Child's OLSAT8 Report
We are using a section from a sample home report to guide you through the different scores and explain how to interpret what you see on your own child’s results.
Here's a breakdown of how the scores work:
In the section marked "purpose," it tells parents that the Otis-Lennon School Ability Test has two sections that together produce a total score:
- Verbal Scale tests verbal reasoning and comprehension
- Nonverbal Scale tests spatial and pattern recognition using geometric shapes
The OLSAT measures students’ verbal and nonverbal reasoning abilities related to academic success. Schools use results to evaluate thinking skills and identify students who may qualify for Gifted and Talented programs.
In the score report, you can find all your child's scores.
- Raw Score is simply the number of questions answered correctly out of the total possible.
- SAI or School Ability Index. This is the headline standardized score. It is designed so that 100 is average for the student's age.
- Age PR or Age Percentile Rank. This compares the student to other students of the same age nationally.
- Age Stanine. This is a simplified 1–9 version of the percentile. All three scores land in the average band (4–6), consistent with the SAI of 103.
- Scaled Score. This is a converted version of the raw score placed on a fixed numerical scale, so scores can be fairly compared across different test forms and administrations.
- Grade PR or Grade Percentile Rank. This compares the student to other students in the same grade nationally.
The student whose scores we will be using as our example is called Kayden
Understanding Kayden 's OLSAT 8 Scores
Here are Kaydens scores:
|
Strand |
Correct |
Percent Correct |
|
OLSAT Verbal Total |
34 of 36 |
94% |
|
Verbal Comprehension |
12 of 12 |
100% |
|
Verbal Reasoning |
22 of 24 |
92% |
|
OLSAT Nonverbal Total |
32 of 36 |
89% |
|
Figural Reasoning |
14 of 18 |
78% |
|
Quantitative Reasoning |
18 of 18 |
100% |
Key observations:
- Kayden achieved 100% on Verbal Comprehension (12/12) and 100% on Quantitative Reasoning (18/18) which are perfect scores in both areas.
- His strongest overall area is verbal comprehension (language understanding).
- Figural Reasoning (78%) is the only strand below 90%. This involves pattern recognition and spatial manipulation of geometric shapes and is the one relative area for potential growth.
Here is a step-by-step breakdown of what those scores mean.
Step 1: Raw Scores (Where Everything Starts)
The very first calculation is simply counting correct answers:
Kayden answered 66 out of 72 questions correctly, which is a strong performance at 92% overall. His verbal and nonverbal scores are closely balanced (34/36 verbal, 32/36 nonverbal).
Raw scores alone don't tell the full story; that's why they get converted into comparative scores below.
Step 2: Scaled Score (SS)
Raw scores are converted to Scaled Scores to allow fair comparison across different test versions and administrations.
|
Section |
Scaled Score |
|
Total |
698 |
|
Verbal |
710 |
|
Nonverbal |
689 |
Kayden 's verbal scaled score (710) is notably higher than his nonverbal (689), which is consistent with the raw scores. This gap is meaningful for understanding his relative strengths.
Step 3: School Ability Index (SAI)
The SAI is the headline score. The one most prominently reported. It's a standardized score built so that:
- 100 = the average for students of the same age
- Most students score between 90–110
- Scores below 70 or above 130 are rare
|
Section |
SAI |
|
Total |
140 |
|
Verbal |
141 |
|
Nonverbal |
134 |
Kayden's SAI scores are exceptionally high. A total SAI of 140 places him well above the 130 threshold that represents the top of the scoring range. In fact fewer than 1% of students score at this level. Both his verbal (141) and nonverbal (134) scores are in this exceptional range, with verbal being a slight strength.
Step 4: Percentile Ranks
Percentile ranks answer: "How did Kayden perform compared to other students?
There are two types reported:
Age Percentile Rank (AgePR) compared to all students of the same age nationally:
|
Section |
Age PR |
|
Total |
99th |
|
Verbal |
99th |
|
Nonverbal |
98th |
Grade Percentile Rank (GrdPR) compared to all students in the same grade:
|
Section |
Grade PR |
|
Total |
99th |
|
Verbal |
99th |
|
Nonverbal |
97th |
Kayden scores at the 99th percentile both by age and by grade, meaning he performed as well as or better than 99% of his peers. This is the highest reportable percentile.
Step 5: Stanines (ST9)
Stanines compress scores into a simple 1–9 scale for easy communication:
|
Range |
Meaning |
|
1–3 |
Below average |
|
4–6 |
Average |
|
7–9 |
Above average |
|
Section |
Age Stanine |
|
Total |
9 |
|
Verbal |
9 |
|
Nonverbal |
9 |
Step 6: NCE Scores
The Normal Curve Equivalent (NCE) is another standardized scale (1–99) used often for program qualification and statistical comparisons across schools and districts.
|
Section |
NCE |
|
Total |
99 |
|
Verbal |
99 |
|
Nonverbal |
89.6 |
An NCE of 99 is the ceiling. Kayden's nonverbal NCE of 89.6, while slightly lower than his verbal, still represents exceptional performance.
The Big Picture: Kayden 's Overall Profile
|
SAI (Total) |
140 |
Exceptionally high (top 1%) |
|
Age Percentile |
99th |
Higher than 99% of same-age peers |
|
Grade Stanine |
9 |
Maximum stanine |
|
Verbal Strength |
99th percentile |
Near-perfect performance |
|
Nonverbal Strength |
97–98th percentile |
Exceptional, with slight edge to verbal |
Kayden demonstrates exceptional school ability across both verbal and nonverbal domains. His scores would typically be reviewed for placement in Gifted & Talented programs, which is one of the stated intended uses of the OLSAT 8. His one area of relative (not absolute) weakness is Figural Reasoning, which could be enriched through puzzles, spatial reasoning games, and geometry activities.
Bell Curve Image Explained
This graph is a visual representation of how a student performed compared to other children in the same age group across the country. Kayden's score is represented by a blue diamond.
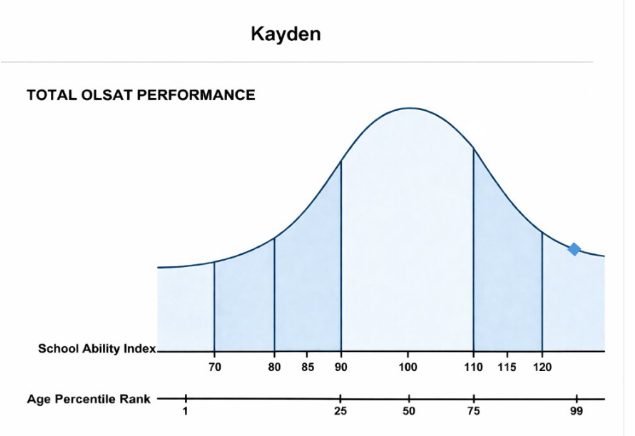
The blue diamond is placed far to the right
The SAI is a normalized score where 100 is the average.
The score is significantly above average and typically falls within the "High Superior" range.
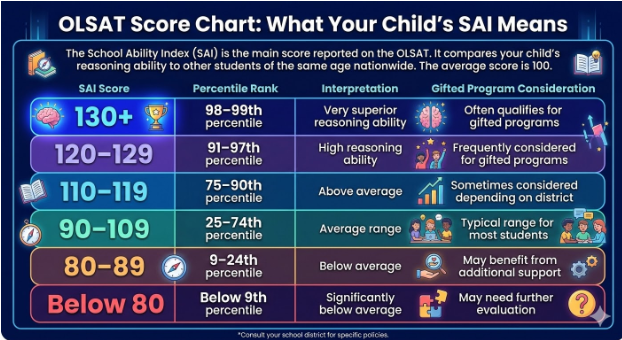
Many Gifted and Talented (G&T) programs use an SAI of 120 or 132 as a qualifying threshold.
How Schools Use OLSAT Scores for GT Admission
Different school systems handle GT admissions differently, but there are some common ways OLSAT scores are used:
Primary Screening Tool
Many districts use the OLSAT as an initial filter to decide who moves forward in the GT process.
If your child meets the district’s score cutoff (often around the top 95th percentile), they can be invited to the next stage of evaluation.
Cutoffs Vary, But High Percentiles Matter
Some programs accept students who score:
- 95th percentile or higher
- 97th–99th percentile
These thresholds aren’t about “passing a test”; they’re about identifying students whose reasoning ability is well above average. A top percentile rank shows your child is performing in the highest levels compared to peers.
Part of a Broader Decision Matrix
Often, OLSAT scores alone aren’t the only factor schools consider. They may also weigh:
- teacher recommendations
- classroom performance
- portfolios of student work
- other ability or achievement test results
This helps schools avoid making placements based solely on one test score, especially because a single test day doesn’t capture the full picture of a child’s abilities.
What OLSAT Scores Really Tell You
For parents, OLSAT results are meaningful because they pinpoint cognitive strengths which has real educational value:
- 1. Strengths and Relative Skills
A strong verbal reasoning score might suggest your child thrives in language-rich tasks.
A very high nonverbal score might indicate strong visual reasoning and spatial problem-solving.
Schools can use this to tailor instruction or enrichment.
- 2. Context Matters
Scores don’t measure intelligence as an absolute; they compare your child with peers. Two children with the same raw score might fall in very different percentiles depending on age norms.
- 3. A Tool, Not a Verdict
Schools use OLSAT scores to open doors, not to label children. Many districts allow later reevaluation or alternative assessments if a child initially misses a cutoff.
- 4. The OLSAT is not an IQ test.
The OLSAT measures skills similar to an IQ test, it is technically a School Ability Test designed to predict classroom performance rather than measure innate, clinical intelligence. Unlike a comprehensive IQ test administered one-on-one by a psychologist, the OLSAT is a group-based assessment that focuses specifically on the reasoning and verbal skills most relevant to academic success.
Tips for Parents
- Focus on growth, not just cutoffs. A high score is exciting, but every result tells you something about how your child thinks, not just whether they qualify.
- Contact your district’s gifted coordinator. Policies change, and cutoffs vary. Knowing the local process empowers you to support your child.
- Use scores constructively. Even if your child just misses a cutoff, the detailed report can help you advocate for the right support and enrichment opportunities in school.
OLSAT Score FAQs
It measures reasoning skills, how your child uses logic to solve problems with words, numbers, and shapes. It’s designed to predict how well a child will handle school-based learning.
A "good" score is relative to your goal. An SAI of 100 is perfectly average. However, for Gifted and Talented eligibility, most districts look for scores in the 90th percentile or higher (an SAI of roughly 120+).
Not exactly. While it correlates with IQ, the OLSAT is a "School Ability Test." It is taken in a group setting and focuses on skills that lead to classroom success, whereas a clinical IQ test is one-on-one and measures a broader range of innate cognitive traits.
The Age PR compares your child to children born in the same month/year. The Grade PR compares them to everyone in their current grade. If your child is young for their grade, the Age PR is often a more accurate reflection of their development.
This usually happens because the test was "easy" for that age group. If most students get 60/70 correct, a score of 61/70 won't result in a high percentile because the competition is so tight at the top.
While every district differs (like NYC or LAUSD), a common benchmark is the 97th percentile. Check your specific district’s website, as some have lowered or raised thresholds recently to adjust for post-pandemic learning trends.
Most school districts only allow the OLSAT to be taken once per year. If your child was sick or there was a major distraction, you may be able to appeal for a re-test or submit an alternative assessment (like a private IQ test).
Nonverbal scores often reflect "fluid intelligence." You can support this at home with Sudoku, Lego sets, pattern-matching games, and spatial reasoning puzzles rather than traditional "studying."
Ask Ariav

A certified teacher with a Master’s in Education and a test preparation specialist with over a decade of experience developing test-specific questions that match the real test’s rigor. Ariav creates materials with clear, detailed explanations that build understanding, boost reasoning skills, and help every child perform their best on the assessment they are facing.


