The PSAT/NMSQT, your one shot at National Merit - Take it seriously
Updated June 2026
For 11th graders, the PSAT is the only route to the National Merit Scholarship Program, which awards roughly $50 million in scholarships each year. Put in some serious practice as only ~1% qualifies! Our PSAT NMSQT PrepPack™ created by our expert Isaac with 30+ years of experience pushes you into that score band: 1,973 practice questions, 8 full-length simulations and interactive lessons.
Get more information by clicking on either of the links:
PSAT NMSQT Practice
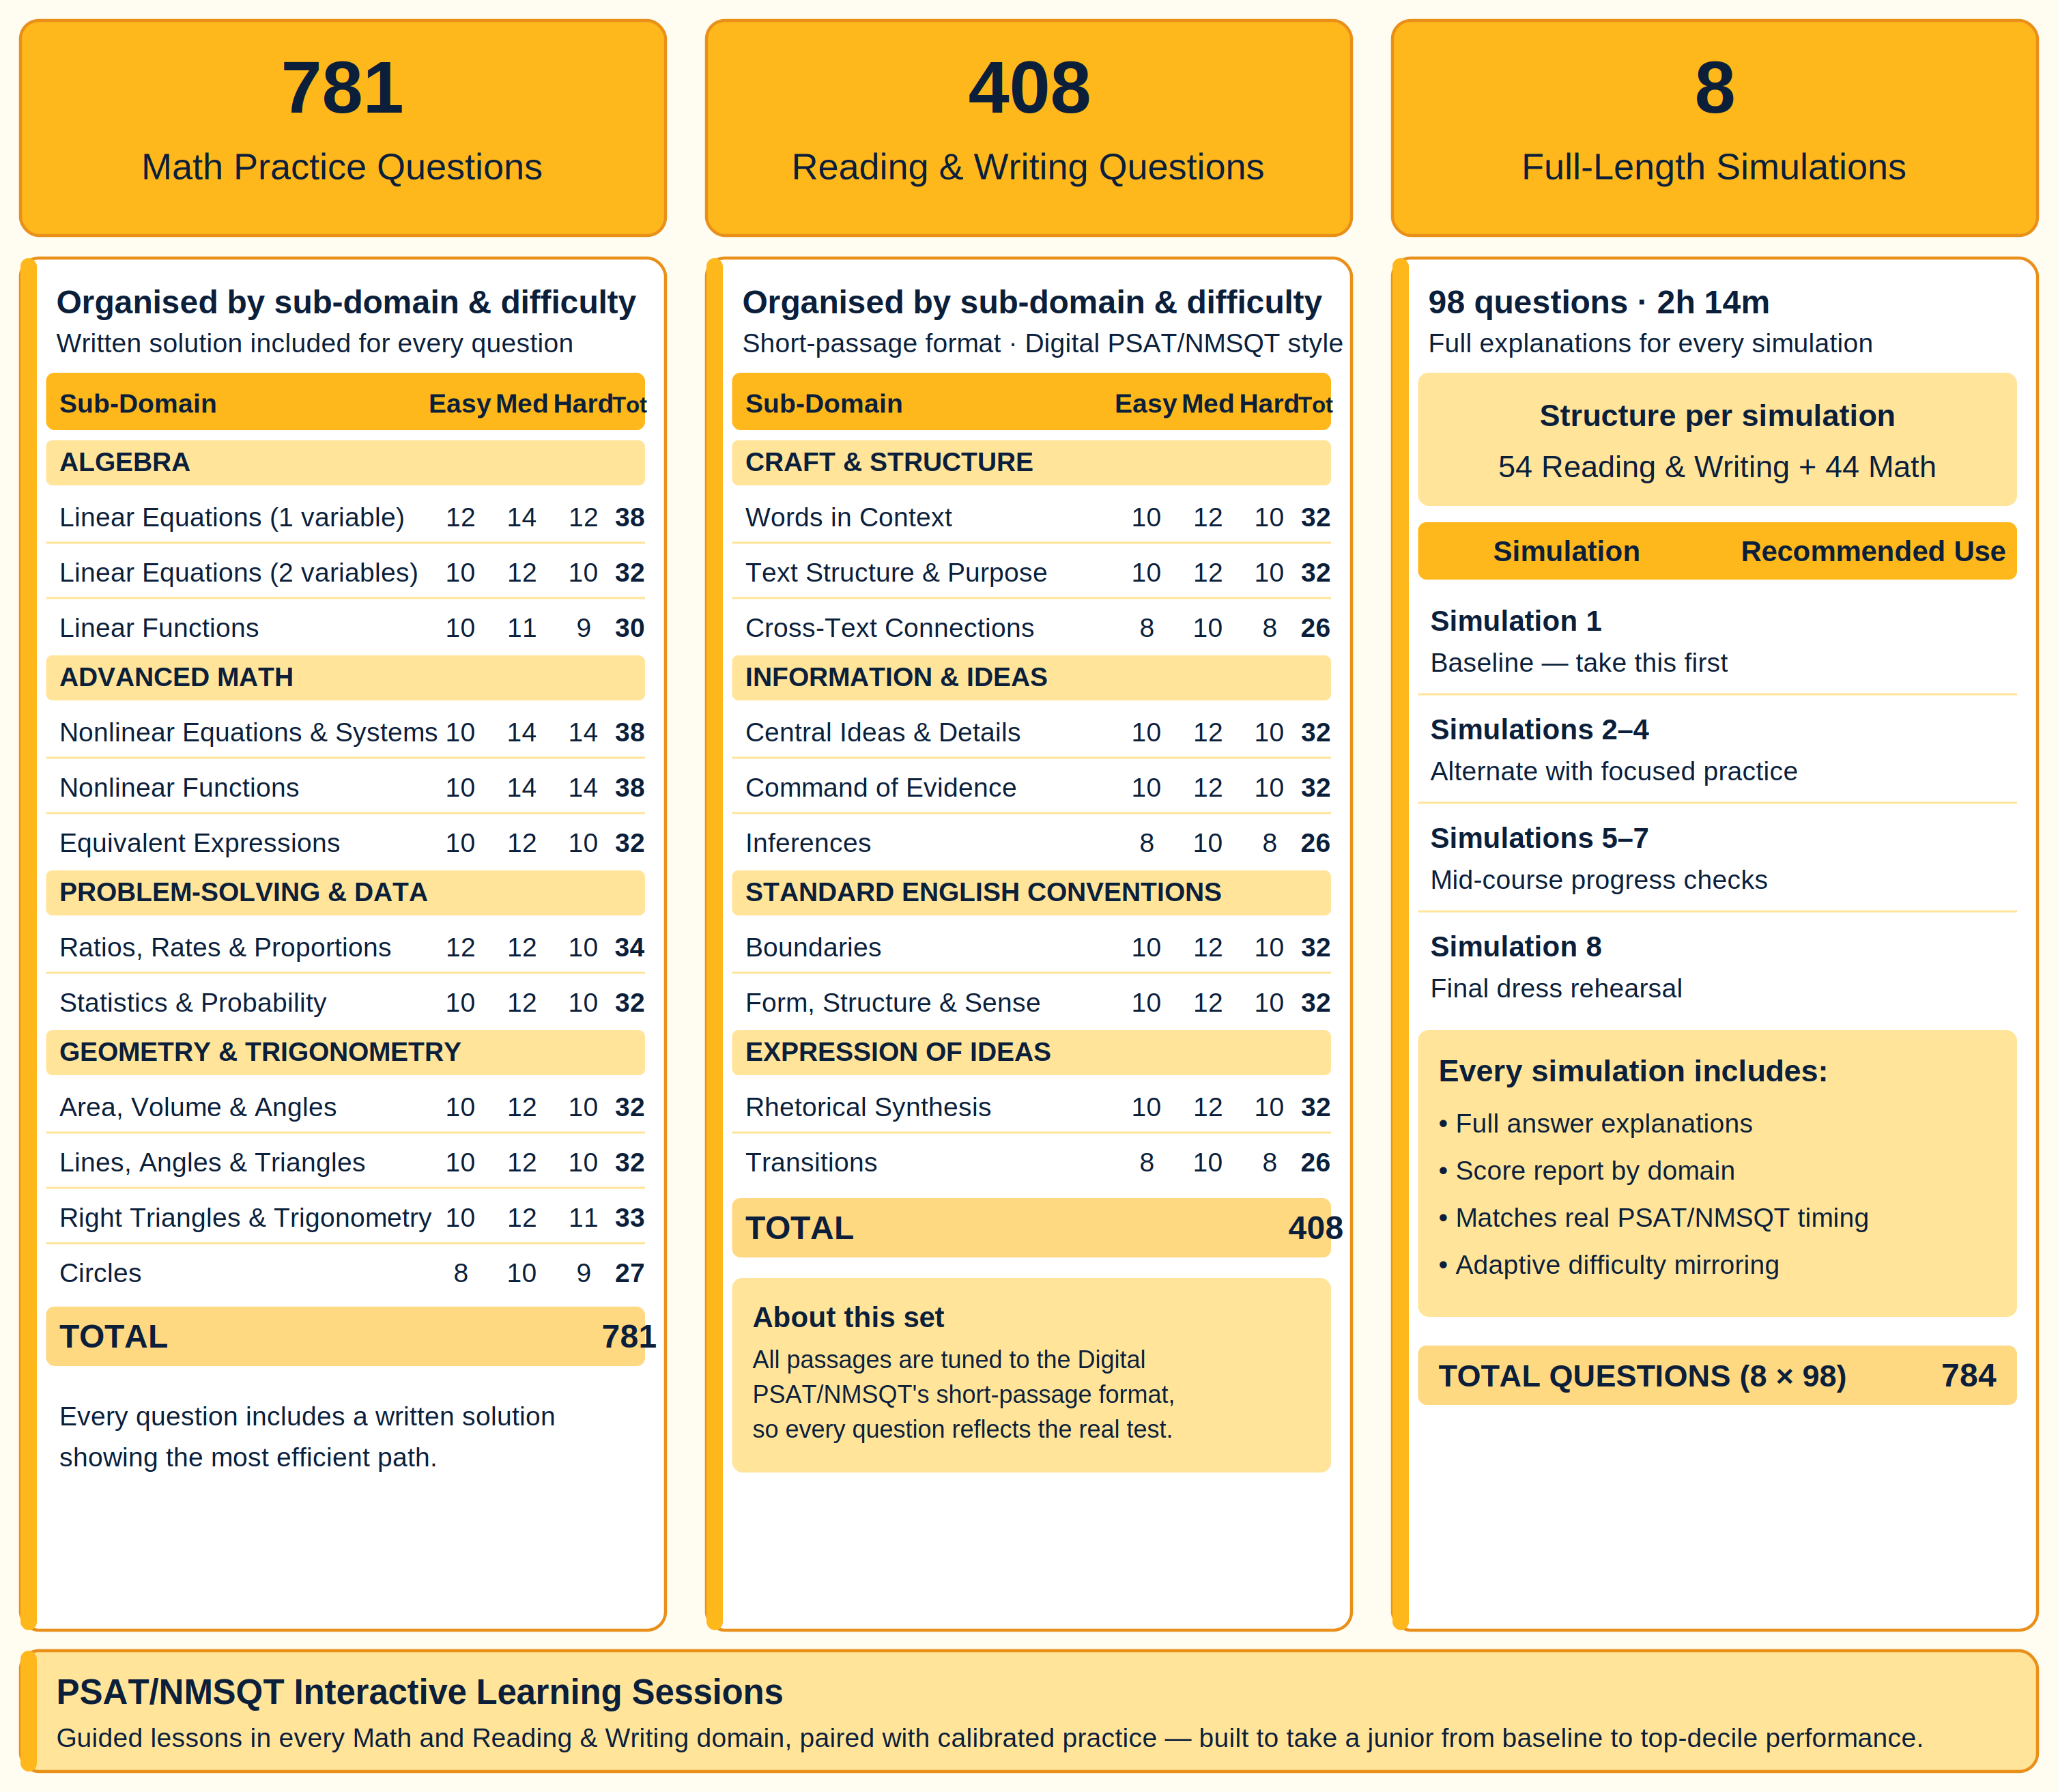
What you get:
- 781 Math practice questions
- 408 Reading & Writing questions
- 8 Simulations
- Interactive lessons
- Retake all tests as often as needed
What is Significant About October in Junior Year – Gain National Merit
The PSAT/NMSQT is not just another standardized test. It is the only PSAT score that counts for National Merit. Sophomores who take the PSAT 10 get a baseline. Juniors who take the PSAT/NMSQT get either a Commendation letter, a Semifinalist letter, or nothing - and the difference between those outcomes can be tens of thousands of dollars in college tuition. A casual approach costs scholarship dollars that compound over four years.
Bonus: every hour also prepares you for the SAT
The PSAT/NMSQT and SAT are both part of the College Board’s SAT Suite of Assessments and measure many of the same core Reading and Writing and Math skills. This means that the time you spend preparing for the PSAT/NMSQT can also help build a strong foundation for the SAT.
However, the SAT includes a higher score range and may present more advanced questions at the upper end. If your main goal is SAT preparation, we recommend using our dedicated SAT PrepPack, which is designed specifically for SAT-level practice. You may still practice for the PSAT and use that knowledge for the SAT, of course.
For Parents: What Are You Buying?
Before you purchase, here's what you should know:
- What this is. A complete, self-paced online prep course for the Digital PSAT/NMSQT (juniors). No live classes - your student logs in when their schedule allows.
- Why the stakes are different from other tests. The PSAT/NMSQT in October is the only PSAT score that counts for National Merit. There is generally no retake for this purpose. A trained junior has measurably better odds of reaching Finalist status.
- Time commitment. Most students see real movement with 4-6 hours per week. Recommended runway: 8-12 weeks before October.
What is Included in Our PSAT NMSQT PrepPack™?
Sample Questions
Example for Math, Advanced Math (Hard Question)
The function ƒ is defined by ƒ(x) = (-10)(3)x + 31
You can use a calculator here: Scientific | Graphs
What is the y-intercept of the graph of y = ƒ(x) in the xy-plane?
Example for Math, Geometry & Trigonometry (Medium-Hard Question)
Triangle PQR is similar to triangle STU, where angle P corresponds to angle S and angles Q and T are right angles.
If sin(P) = 420/429, what is the value of sin(S)?
Example for Reading & Writing, Information & Ideas (Hard Question)
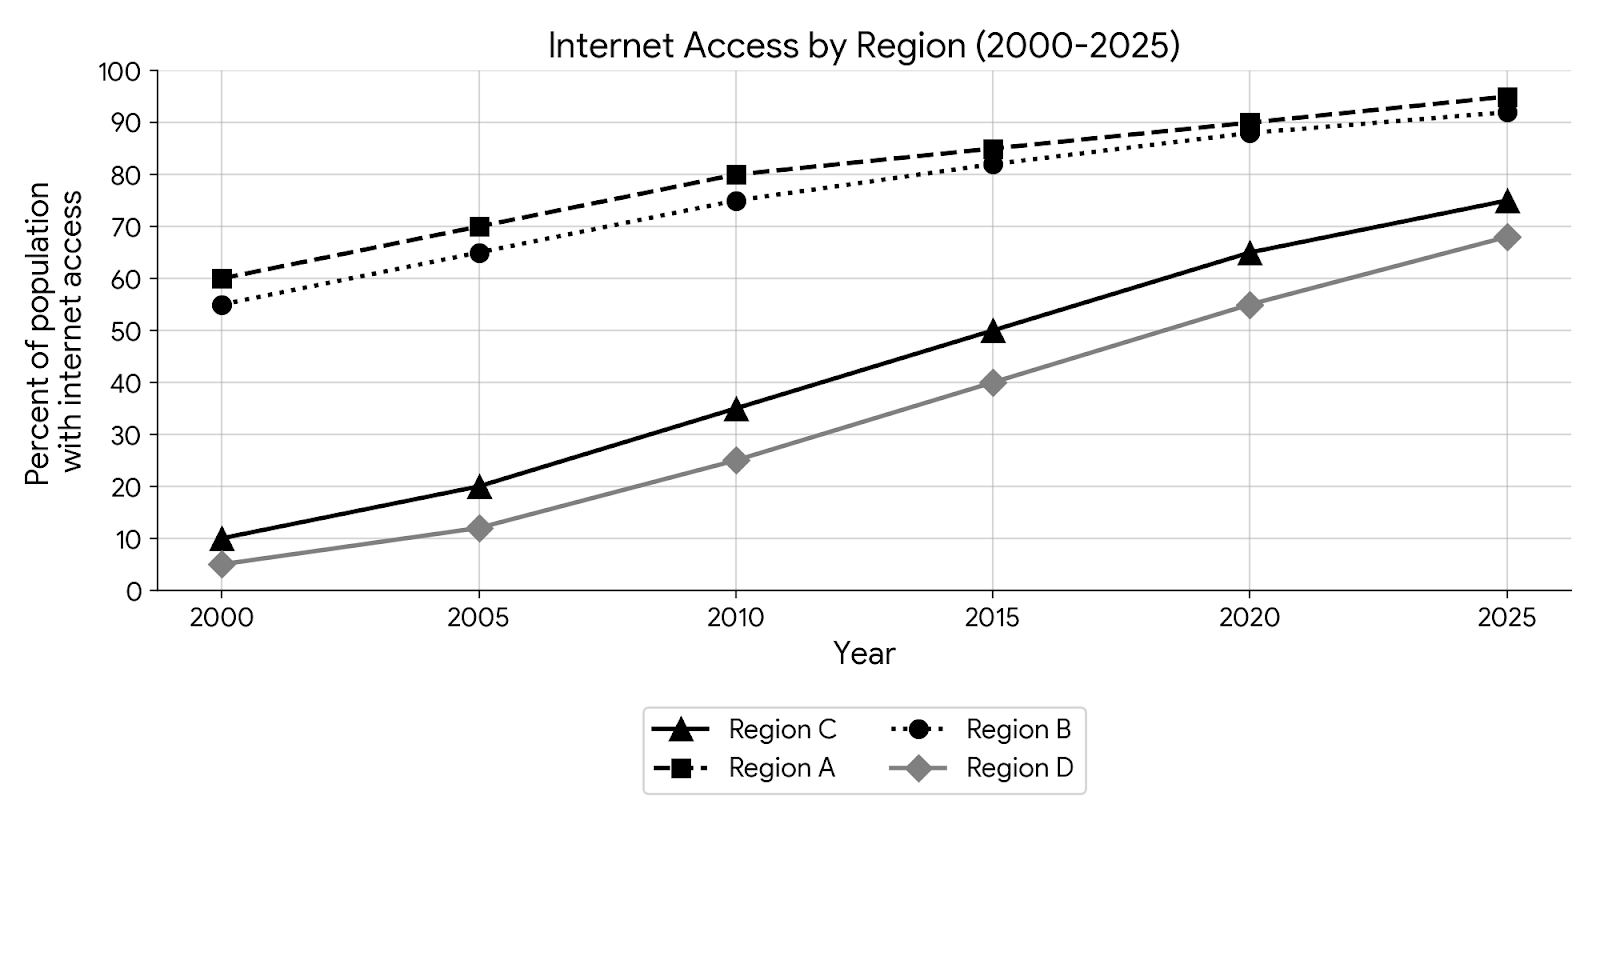
Global internet access has expanded significantly since 2000, but the growth has varied by region. Regions A and B, for example, already had substantial internet penetration in 2000, with 55% or more of their populations online. The most dramatic increases in internet access since 2000 have occurred in areas like Region C, where the percentage of the population with access went from _____
Which choice most effectively uses data from the graph to complete the assertion?
Why TestPrep Online for Your PSAT NMSQT Practice?
1. Calibrated for the top score band
- Many free tools cover only the basics.
- The score gap that decides on the results and the scholarships granted requires results on the higher levels, which we provide.
- Our practice sets with hard style simulation tracks and hard questions are built specifically for those that aim to be commended.
2. Same type of content as the SAT, by design
- The College Board defines identical content domains for the PSAT/NMSQT and the SAT.
- Every hour of PSAT practice also helps build SAT readiness.
3. Built for the Digital format style questions
Our Expert - Isaac
 Our PSAT practice is developed and led by Isaac, who has more than 30 years experience in psychometric style testing and specifically has designed our SAT and PSAT PrepPacks™ lately. If you need any help whilst practicing, guidance, explanations or want to know if you are on the right track, you can contact Isaac directly here: isaac@testprep-online.com
FAQs
Yes. The PSAT/NMSQT is taken in October of 11th grade. This pack is built around that specific test, score scale, and stakes.
The “Selection Index” is computed from the PSAT/NMSQT score. Each state sets its own cutoff for Semifinalist status, usually between 207 and 223. A Selection Index of 220+ is broadly competitive; 223+ is safe in nearly all states.
No. The only PSAT/NMSQT administration that counts toward National Merit is the October date of 11th grade. There is no qualifying retake.
Our simulations are not adaptive yet but include the full difficulty range and mimic the real questions. We are actively working on adaptive simulations.
Yes. The content domains in the real test are identical between PSAT/NMSQT and SAT. The SAT pushes further at the hardest end, but the foundations are the same. Therefore, despite the similarities, if you want to practice for the SAT and not the PSAT, we recommend our SAT product.


